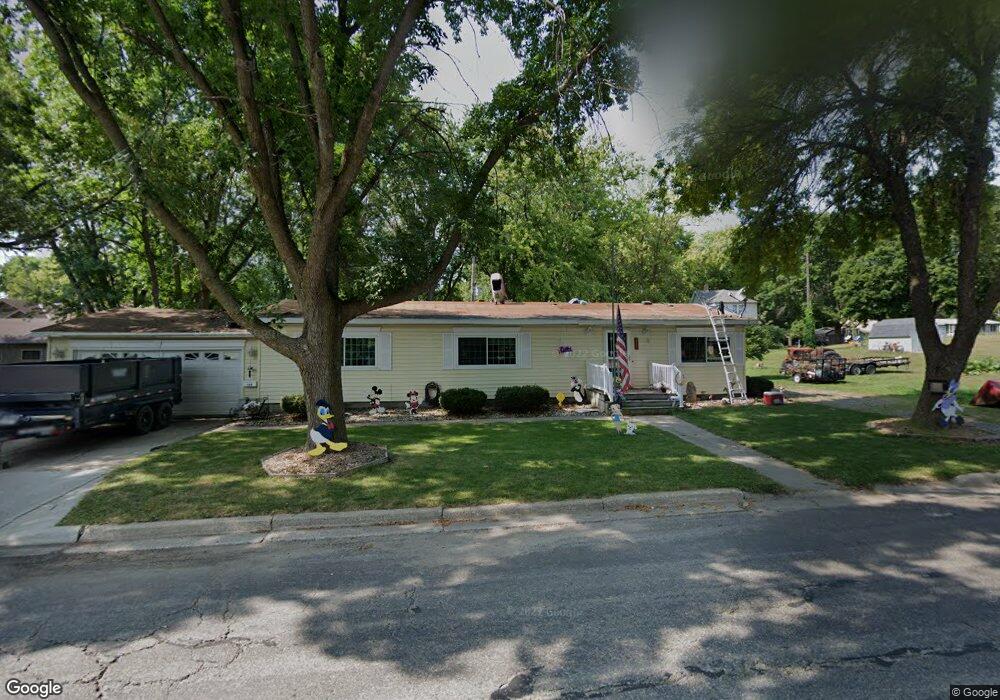
305 N 12th St Montevideo, MN 56265
Estimated Value: $151,000 - $176,000
1
Bed
2
Baths
1,596
Sq Ft
$104/Sq Ft
Est. Value
About This Home
This home is located at 305 N 12th St, Montevideo, MN 56265 and is currently estimated at $166,705, approximately $104 per square foot. 305 N 12th St is a home located in Chippewa County with nearby schools including Sanford Education Center, Ramsey Elementary School, and Montevideo Middle School.
Ownership History
Date
Name
Owned For
Owner Type
Purchase Details
Closed on
Aug 27, 2024
Sold by
Grams Kelly M
Bought by
Saine Susan K and Saine Stephen M
Current Estimated Value
Purchase Details
Closed on
Apr 19, 2011
Sold by
Grams Carol A
Bought by
Grams Carol A and Grams Kelly M
Purchase Details
Closed on
Apr 13, 2009
Sold by
Grams Shawn K
Bought by
Grams Carol A
Purchase Details
Closed on
Nov 6, 2008
Sold by
Ward Robert P
Bought by
Grams Shawn K
Home Financials for this Owner
Home Financials are based on the most recent Mortgage that was taken out on this home.
Original Mortgage
$25,000
Interest Rate
6.11%
Purchase Details
Closed on
Sep 29, 2006
Sold by
Kanthak Kay
Bought by
Ward Robert P
Home Financials for this Owner
Home Financials are based on the most recent Mortgage that was taken out on this home.
Original Mortgage
$35,051
Interest Rate
6.49%
Create a Home Valuation Report for This Property
The Home Valuation Report is an in-depth analysis detailing your home's value as well as a comparison with similar homes in the area
Home Values in the Area
Average Home Value in this Area
Purchase History
| Date | Buyer | Sale Price | Title Company |
|---|---|---|---|
| Saine Susan K | $140,000 | Ancona Title | |
| Grams Carol A | -- | None Available | |
| Grams Carol A | -- | None Available | |
| Grams Shawn K | $66,000 | None Available | |
| Ward Robert P | $44,300 | None Available |
Source: Public Records
Mortgage History
| Date | Status | Borrower | Loan Amount |
|---|---|---|---|
| Previous Owner | Grams Shawn K | $25,000 | |
| Previous Owner | Ward Robert P | $35,051 |
Source: Public Records
Tax History Compared to Growth
Tax History
| Year | Tax Paid | Tax Assessment Tax Assessment Total Assessment is a certain percentage of the fair market value that is determined by local assessors to be the total taxable value of land and additions on the property. | Land | Improvement |
|---|---|---|---|---|
| 2025 | $2,072 | $157,200 | $9,400 | $147,800 |
| 2024 | $1,550 | $154,200 | $9,400 | $144,800 |
| 2023 | $1,276 | $149,300 | $9,400 | $139,900 |
| 2022 | $1,022 | $124,700 | $9,400 | $115,300 |
| 2021 | $910 | $109,900 | $9,400 | $100,500 |
| 2020 | $704 | $94,400 | $8,200 | $86,200 |
| 2019 | $1,113 | $92,400 | $8,200 | $84,200 |
| 2018 | $876 | $59,334 | $0 | $0 |
| 2017 | $882 | $77,400 | $0 | $0 |
| 2016 | $858 | $47,700 | $0 | $0 |
| 2015 | -- | $47,700 | $0 | $0 |
| 2014 | -- | $45,300 | $0 | $0 |
| 2013 | -- | $45,300 | $0 | $0 |
Source: Public Records
Map
Nearby Homes
- 305 N 12th St
- 303 N 12th St
- 310 310 N 11 Street--
- 310 310 N 11 St
- 304 Cedar Ln
- 310 N 11th St
- 318 N 11th St
- 1103 E Lincoln Ave
- 405 N 12th St
- 312 Cedar Ln
- 312 312 Cedar Ln
- 306 Cedar Ln
- 306 306 Cedar Ln
- 1205 E Lincoln Ave
- 1205 E Lincoln Ave
- 314 Cedar Ln
- 308 Cedar Ln
- 316 Cedar Ln
- 1106 Black Oak Ave
- 404 N 11th St