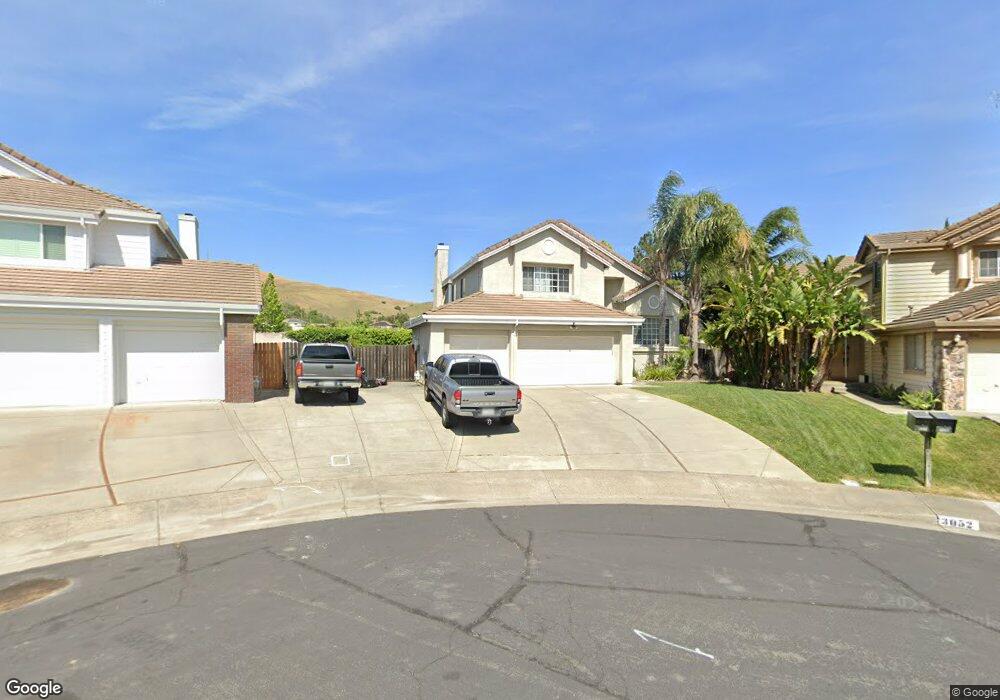
3052 Ebony Ct Fairfield, CA 94533
Estimated Value: $625,000 - $690,000
4
Beds
3
Baths
2,261
Sq Ft
$290/Sq Ft
Est. Value
About This Home
This home is located at 3052 Ebony Ct, Fairfield, CA 94533 and is currently estimated at $655,863, approximately $290 per square foot. 3052 Ebony Ct is a home located in Solano County with nearby schools including Laurel Creek Elementary School, Grange Middle School, and Fairfield High School.
Ownership History
Date
Name
Owned For
Owner Type
Purchase Details
Closed on
Dec 18, 2023
Sold by
Robbins David William
Bought by
Robbins Living Trust and Robbins
Current Estimated Value
Purchase Details
Closed on
Oct 1, 2014
Sold by
Robbins Sandra and Robbins David W
Bought by
Robbins David W and Robbins Sandra
Home Financials for this Owner
Home Financials are based on the most recent Mortgage that was taken out on this home.
Original Mortgage
$284,100
Interest Rate
3.22%
Mortgage Type
New Conventional
Purchase Details
Closed on
Sep 9, 2004
Sold by
Cruz Sandra E
Bought by
Cruz Sandra E and Robbins David W
Home Financials for this Owner
Home Financials are based on the most recent Mortgage that was taken out on this home.
Original Mortgage
$310,000
Interest Rate
5.36%
Mortgage Type
Purchase Money Mortgage
Purchase Details
Closed on
Jun 15, 2001
Sold by
Cruz Clarence V
Bought by
Cruz Sandra E
Create a Home Valuation Report for This Property
The Home Valuation Report is an in-depth analysis detailing your home's value as well as a comparison with similar homes in the area
Home Values in the Area
Average Home Value in this Area
Purchase History
| Date | Buyer | Sale Price | Title Company |
|---|---|---|---|
| Robbins Living Trust | -- | None Listed On Document | |
| Robbins David W | -- | None Available | |
| Cruz Sandra E | $155,000 | Financial Title Company | |
| Cruz Sandra E | -- | -- |
Source: Public Records
Mortgage History
| Date | Status | Borrower | Loan Amount |
|---|---|---|---|
| Previous Owner | Robbins David W | $284,100 | |
| Previous Owner | Cruz Sandra E | $310,000 |
Source: Public Records
Tax History
| Year | Tax Paid | Tax Assessment Tax Assessment Total Assessment is a certain percentage of the fair market value that is determined by local assessors to be the total taxable value of land and additions on the property. | Land | Improvement |
|---|---|---|---|---|
| 2025 | $4,759 | $425,692 | $106,101 | $319,591 |
| 2024 | $4,759 | $417,346 | $104,021 | $313,325 |
| 2023 | $4,534 | $409,164 | $101,982 | $307,182 |
| 2022 | $4,477 | $401,142 | $99,983 | $301,159 |
| 2021 | $4,432 | $393,277 | $98,023 | $295,254 |
| 2020 | $4,327 | $389,245 | $97,018 | $292,227 |
| 2019 | $4,219 | $381,614 | $95,116 | $286,498 |
| 2018 | $4,354 | $374,132 | $93,251 | $280,881 |
| 2017 | $4,151 | $366,797 | $91,423 | $275,374 |
| 2016 | $4,119 | $359,606 | $89,631 | $269,975 |
| 2015 | $3,844 | $354,205 | $88,285 | $265,920 |
| 2014 | $3,807 | $347,267 | $86,556 | $260,711 |
Source: Public Records
Map
Nearby Homes
- 1175 Hickory Ave
- 1031 Suffolk Way
- 2913 Balsam Ct
- 3862 Clay Bank Rd
- 2856 Rebecca Dr
- 2952 Inspiration Dr
- 989 Suffolk Way
- 1401 Spur Ln
- 1417 Spur Ln
- 3045 Balance Cir
- 2924 Redwood Dr
- 3280 Mustang Cir
- 1504 Millennium Way
- 793 Marigold Dr
- 1508 Millennium Way
- 1512 Millennium Way
- 1516 Millennium Way
- 1548 Nightfall Ln
- 1571 Tommy Ln
- 738 Marsh Place
- 3048 Ebony Ct
- 3058 Ebony Ct
- 1190 Hickory Ave
- 3063 Ebony Ct
- 1186 Hickory Ave
- 1182 Hickory Ave
- 1194 Hickory Ave
- 3057 Ebony Ct
- 1174 Hickory Ave
- 1198 Hickory Ave
- 3051 Ebony Ct
- 1170 Hickory Ave
- 1179 Hickory Ave
- 1183 Hickory Ave
- 1187 Hickory Ave
- 1202 Hickory Ave
- 1169 Hickory Ave
- 1191 Hickory Ave
- 3249 Lagunita Cir
- 1164 Hickory Ave
Your Personal Tour Guide
Ask me questions while you tour the home.