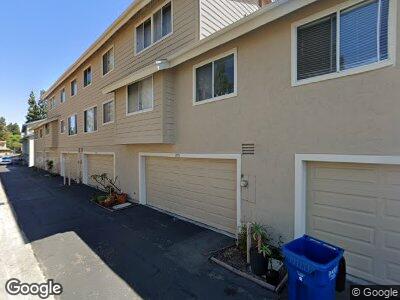
3055 Old Bridgeport Way Unit 3 San Diego, CA 92111
Clairemont Mesa West NeighborhoodEstimated Value: $817,793 - $892,000
2
Beds
3
Baths
1,368
Sq Ft
$623/Sq Ft
Est. Value
About This Home
This home is located at 3055 Old Bridgeport Way Unit 3, San Diego, CA 92111 and is currently estimated at $851,698, approximately $622 per square foot. 3055 Old Bridgeport Way Unit 3 is a home located in San Diego County with nearby schools including Holmes Elementary, Marston Middle School, and Clairemont High School.
Ownership History
Date
Name
Owned For
Owner Type
Purchase Details
Closed on
Feb 7, 2002
Sold by
Morton Todd D and Seim Jennifer A
Bought by
Finley Paula
Current Estimated Value
Home Financials for this Owner
Home Financials are based on the most recent Mortgage that was taken out on this home.
Original Mortgage
$162,000
Interest Rate
6.8%
Purchase Details
Closed on
Jul 20, 1999
Sold by
Yates Craig A and Yates Susan D
Bought by
Morton Todd D and Seim Jennifer A
Home Financials for this Owner
Home Financials are based on the most recent Mortgage that was taken out on this home.
Original Mortgage
$161,600
Interest Rate
7.64%
Purchase Details
Closed on
Jul 7, 1999
Sold by
Yates Craig A
Bought by
Yates Craig A and Yates Susan D
Home Financials for this Owner
Home Financials are based on the most recent Mortgage that was taken out on this home.
Original Mortgage
$161,600
Interest Rate
7.64%
Purchase Details
Closed on
Sep 28, 1983
Create a Home Valuation Report for This Property
The Home Valuation Report is an in-depth analysis detailing your home's value as well as a comparison with similar homes in the area
Home Values in the Area
Average Home Value in this Area
Purchase History
| Date | Buyer | Sale Price | Title Company |
|---|---|---|---|
| Finley Paula | $292,000 | Lawyers Title | |
| Morton Todd D | $202,000 | Southland Title | |
| Yates Craig A | -- | Southland Title | |
| -- | $102,000 | -- |
Source: Public Records
Mortgage History
| Date | Status | Borrower | Loan Amount |
|---|---|---|---|
| Closed | Finley Paula | $160,500 | |
| Closed | Finley Paula | $162,000 | |
| Previous Owner | Morton Todd D | $161,600 | |
| Closed | Morton Todd D | $30,300 |
Source: Public Records
Tax History Compared to Growth
Tax History
| Year | Tax Paid | Tax Assessment Tax Assessment Total Assessment is a certain percentage of the fair market value that is determined by local assessors to be the total taxable value of land and additions on the property. | Land | Improvement |
|---|---|---|---|---|
| 2024 | $5,139 | $422,892 | $260,690 | $162,202 |
| 2023 | $5,024 | $414,601 | $255,579 | $159,022 |
| 2022 | $4,889 | $406,472 | $250,568 | $155,904 |
| 2021 | $4,854 | $398,503 | $245,655 | $152,848 |
| 2020 | $4,795 | $394,418 | $243,137 | $151,281 |
| 2019 | $4,708 | $386,685 | $238,370 | $148,315 |
| 2018 | $4,401 | $379,104 | $233,697 | $145,407 |
| 2017 | $80 | $371,671 | $229,115 | $142,556 |
| 2016 | $4,225 | $364,384 | $224,623 | $139,761 |
| 2015 | $4,162 | $358,911 | $221,249 | $137,662 |
| 2014 | $4,095 | $351,882 | $216,916 | $134,966 |
Source: Public Records
Map
Nearby Homes
- 3057 Old Bridgeport Way
- 3111 Old Bridgeport Way
- 3164 W Fox Run Way
- 3611 Mount Aclare Ave
- 2956 Ulric St
- 7016 Park Mesa Way Unit 23
- 7036 Park Mesa Way Unit 33
- 7076 Park Mesa Way Unit 55
- 7029 Hilton Place
- 3625 Mount Everest Blvd
- 5403 Via Carancho
- 2750 Wheatstone St Unit 109
- 2750 Wheatstone St Unit 22
- 2750 Wheatstone St Unit 207
- 2750 Wheatstone St
- 7162 Beagle St
- 7273 Arillo St
- 6987 Tanglewood Rd
- 3551 Ben St
- 3961 Mount Aladin Ave
- 3055 Old Bridgeport Way Unit 3
- 3053 Old Bridgeport Way
- 3059 Old Bridgeport Way
- 3061 Old Bridgeport Way
- 3043 Old Bridgeport Way
- 3045 Old Bridgeport Way
- 3063 Old Bridgeport Way
- 3047 Old Bridgeport Way
- 3049 Old Bridgeport Way
- 3067 Old Bridgeport Way
- 3037 Old Bridgeport Way
- 3023 Old Bridgeport Way
- 3035 Old Bridgeport Way
- 3069 Old Bridgeport Way
- 3033 Old Bridgeport Way
- 3031 Old Bridgeport Way
- 3021 Old Bridgeport Way
- 3071 Old Bridgeport Way
- 3029 Old Bridgeport Way
- 3027 Old Bridgeport Way