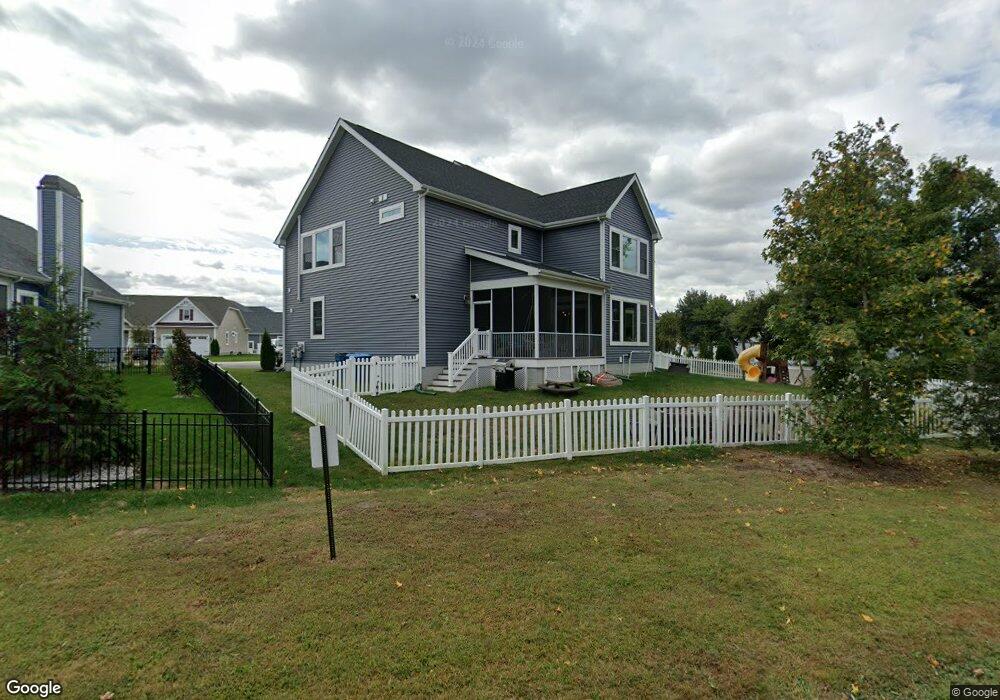
30569 Peaceful Ln Unit Lot 7 Ocean View, DE 19970
Estimated Value: $836,000 - $878,000
4
Beds
3
Baths
2,144
Sq Ft
$397/Sq Ft
Est. Value
About This Home
This home is located at 30569 Peaceful Ln Unit Lot 7, Ocean View, DE 19970 and is currently estimated at $850,874, approximately $396 per square foot. 30569 Peaceful Ln Unit Lot 7 is a home located in Sussex County with nearby schools including Lord Baltimore Elementary School, Selbyville Middle School, and Indian River High School.
Ownership History
Date
Name
Owned For
Owner Type
Purchase Details
Closed on
Nov 20, 2020
Sold by
Holleman Travis D and Holleman Talon B
Bought by
Renaldo Michael A
Current Estimated Value
Purchase Details
Closed on
Jul 19, 2017
Sold by
Holleman Travis D
Bought by
Holleman Talon B and Holleman Travid D
Home Financials for this Owner
Home Financials are based on the most recent Mortgage that was taken out on this home.
Original Mortgage
$280,219
Interest Rate
3.5%
Mortgage Type
FHA
Purchase Details
Closed on
Jul 13, 2017
Sold by
Schell Brothers Llc A Delaware Limited L
Bought by
Holleman Travis D
Home Financials for this Owner
Home Financials are based on the most recent Mortgage that was taken out on this home.
Original Mortgage
$280,219
Interest Rate
3.5%
Mortgage Type
FHA
Purchase Details
Closed on
Mar 2, 2017
Sold by
Tac Beacon I Llc A Delaware Limited Liab
Bought by
Schell Brothers Llc A Delaware Limited L
Create a Home Valuation Report for This Property
The Home Valuation Report is an in-depth analysis detailing your home's value as well as a comparison with similar homes in the area
Home Values in the Area
Average Home Value in this Area
Purchase History
| Date | Buyer | Sale Price | Title Company |
|---|---|---|---|
| Renaldo Michael A | $550,000 | None Available | |
| Holleman Talon B | -- | None Available | |
| Holleman Travis D | $493,640 | None Available | |
| Schell Brothers Llc A Delaware Limited L | $129,620 | None Available |
Source: Public Records
Mortgage History
| Date | Status | Borrower | Loan Amount |
|---|---|---|---|
| Previous Owner | Holleman Travis D | $280,219 |
Source: Public Records
Tax History Compared to Growth
Tax History
| Year | Tax Paid | Tax Assessment Tax Assessment Total Assessment is a certain percentage of the fair market value that is determined by local assessors to be the total taxable value of land and additions on the property. | Land | Improvement |
|---|---|---|---|---|
| 2025 | $1,696 | $41,100 | $3,750 | $37,350 |
| 2024 | $1,779 | $41,100 | $3,750 | $37,350 |
| 2023 | $1,779 | $41,100 | $3,750 | $37,350 |
| 2022 | $1,751 | $41,100 | $3,750 | $37,350 |
| 2021 | $1,643 | $41,100 | $3,750 | $37,350 |
| 2020 | $1,598 | $41,100 | $3,750 | $37,350 |
| 2019 | $1,561 | $41,100 | $3,750 | $37,350 |
| 2018 | $1,582 | $41,100 | $0 | $0 |
| 2017 | $1,611 | $41,100 | $0 | $0 |
Source: Public Records
Map
Nearby Homes
- 37239 Main St
- Lot 3 Clubhouse Rd
- 30646 Peaceful Ln
- 406 Serrill Ave
- 14626 Blue Heron Dr
- 37526 Oak St
- 155 Naomi Dr Unit 56
- 131 Naomi Dr
- 37486 Seaside Dr
- 30923 Sea Breeze Ln
- 36728 Baltimore Ave
- 37727 Lagoon Ln
- 53 Tributary Ln
- 31001 Waterview Ct
- 5 Blue Stream Ln
- 45 Docs Place Extension
- 29 Pier Point Dr Unit 40
- 26 Pier Point Dr Unit 49
- 36466 Old Mill Rd
- 36697 Clubhouse Rd
- 30569 Peaceful Ln
- 30563 Peaceful Ln
- 30573 Peaceful Ln
- 30577 Peaceful Ln
- 30562 Peaceful Ln
- 30557 Peaceful Ln
- 37249 Main St
- 30585 Peaceful Ln
- 37259 Main St
- 37259 Main St
- 37239 Main St
- 30580 Peaceful Ln
- 30580 Peaceful Ln Unit Lot 65
- 30580 Peaceful Ln
- 37267 Main St
- 30644 Peaceful Ln
- 30551 Peaceful Ln
- 37220 Main St
- 30552 Peaceful Ln
- 30552 Peaceful Ln Unit Lot 63