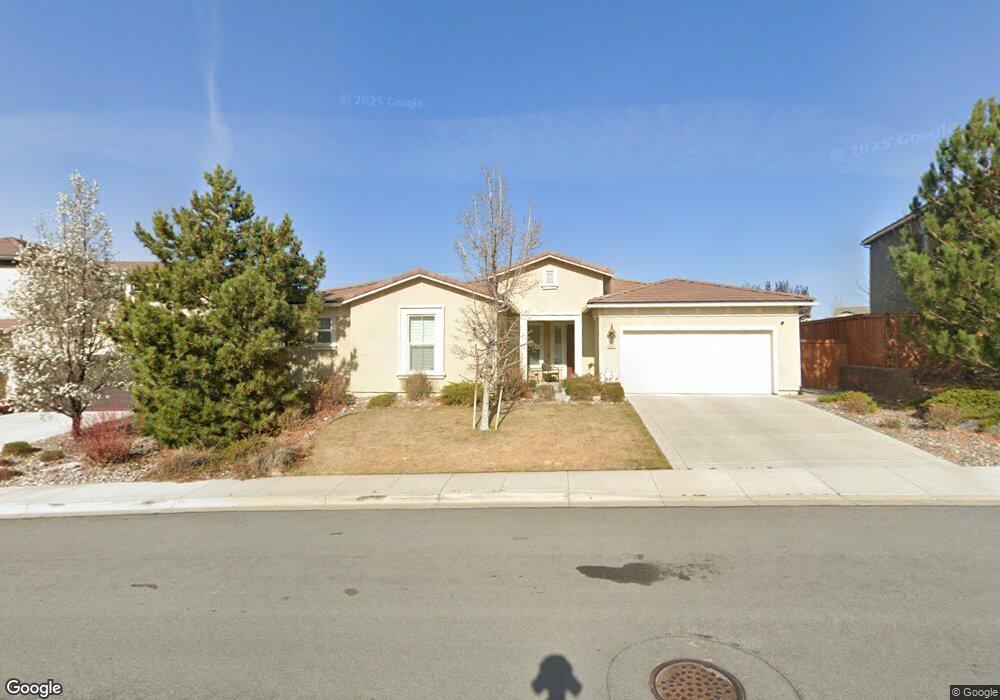
3057 Brachetto Loop Sparks, NV 89434
D'Andrea NeighborhoodEstimated Value: $751,352 - $828,000
3
Beds
3
Baths
2,759
Sq Ft
$285/Sq Ft
Est. Value
About This Home
This home is located at 3057 Brachetto Loop, Sparks, NV 89434 and is currently estimated at $787,088, approximately $285 per square foot. 3057 Brachetto Loop is a home with nearby schools including Marvin Moss Elementary School, Lou Mendive Middle School, and Edward C Reed High School.
Ownership History
Date
Name
Owned For
Owner Type
Purchase Details
Closed on
Aug 1, 2014
Sold by
Frugoli Terry and Patellaro Geralynn
Bought by
The Frugoli Patellaro Living Trust
Current Estimated Value
Purchase Details
Closed on
Mar 22, 2012
Sold by
Patellaro Geralyn
Bought by
Frugoll Terry J
Home Financials for this Owner
Home Financials are based on the most recent Mortgage that was taken out on this home.
Original Mortgage
$269,366
Interest Rate
3.83%
Mortgage Type
New Conventional
Purchase Details
Closed on
Feb 8, 2012
Sold by
Lennar Reno Llc
Bought by
Frugoli Terry J and Patellaro Geralyn
Home Financials for this Owner
Home Financials are based on the most recent Mortgage that was taken out on this home.
Original Mortgage
$269,366
Interest Rate
3.83%
Mortgage Type
New Conventional
Purchase Details
Closed on
May 27, 2011
Sold by
Lw Dandrea Llc
Bought by
Lennar Reno Llc
Create a Home Valuation Report for This Property
The Home Valuation Report is an in-depth analysis detailing your home's value as well as a comparison with similar homes in the area
Home Values in the Area
Average Home Value in this Area
Purchase History
| Date | Buyer | Sale Price | Title Company |
|---|---|---|---|
| The Frugoli Patellaro Living Trust | -- | None Available | |
| Frugoll Terry J | -- | North American Title Reno | |
| Frugoli Terry J | $337,000 | North American Title Reno | |
| Lennar Reno Llc | -- | Ticor Title Reno |
Source: Public Records
Mortgage History
| Date | Status | Borrower | Loan Amount |
|---|---|---|---|
| Previous Owner | Frugoli Terry J | $269,366 |
Source: Public Records
Tax History
| Year | Tax Paid | Tax Assessment Tax Assessment Total Assessment is a certain percentage of the fair market value that is determined by local assessors to be the total taxable value of land and additions on the property. | Land | Improvement |
|---|---|---|---|---|
| 2026 | $3,417 | $218,498 | $59,535 | $158,963 |
| 2024 | $6,446 | $216,612 | $55,283 | $161,329 |
| 2023 | $6,446 | $211,676 | $59,798 | $151,878 |
| 2022 | $6,260 | $175,657 | $49,392 | $126,265 |
| 2021 | $5,797 | $174,467 | $49,385 | $125,082 |
| 2020 | $5,451 | $173,026 | $48,195 | $124,831 |
| 2019 | $5,090 | $161,538 | $43,971 | $117,567 |
| 2018 | $4,859 | $148,365 | $33,975 | $114,390 |
| 2017 | $4,658 | $145,490 | $31,416 | $114,074 |
| 2016 | $4,538 | $146,441 | $30,524 | $115,917 |
| 2015 | $4,529 | $138,555 | $28,798 | $109,757 |
| 2014 | $4,390 | $123,489 | $28,679 | $94,810 |
| 2013 | -- | $117,682 | $27,727 | $89,955 |
Source: Public Records
Map
Nearby Homes
- 3375 Culpepper Dr
- 3307 Vincinato Dr
- 2485 Firenze Dr
- 2600 Anqua Ct
- 2854 Cintoia Dr
- 2199 Lucca Ln
- 2419 Tecumseh Way
- 2389 Tecumseh Way Unit 15
- 2381 Tecumseh Way Unit 18
- 2408 Tecumseh Way
- 2730 Aristedes Dr
- 4060 Culpepper Dr
- 1750 Corleone Dr
- 4154 Pillary Ct
- 1759 Veneto Dr
- 4292 Desert Highlands Dr Unit 1
- 4301 Pinnacle Vista Ct Unit 1
- 0 Martini Rd Unit 260001673
- 1741 Medolla Dr
- 3142 Jarbidge Way
- 3051 Brachetto Loop
- 3063 Brachetto Loop
- 3045 Brachetto Loop
- 3069 Brachetto Loop
- 3060 Brachetto Loop
- 3050 Brachetto Loop
- 3072 Brachetto Loop
- 3075 Brachetto Loop
- 3042 Brachetto Loop
- 3037 Brachetto Loop
- 3078 Brachetto Loop
- 2916 Lessini Ct
- 3081 Brachetto Loop
- 2924 Lessini Ct
- 3028 Brachetto Loop
- 3031 Brachetto Loop
- 3084 Brachetto Loop
- 3087 Brachetto Loop
- 2912 Brachetto Loop
- 3025 Brachetto Loop
Your Personal Tour Guide
Ask me questions while you tour the home.