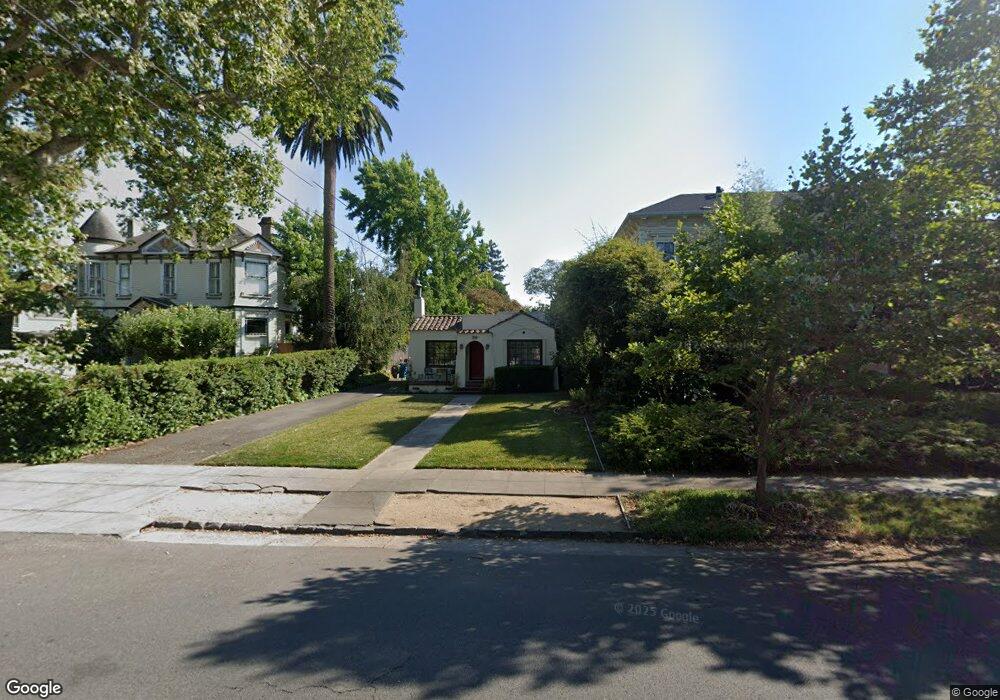
306 6th St Petaluma, CA 94952
Western Petaluma NeighborhoodEstimated Value: $671,683 - $1,080,000
2
Beds
1
Bath
922
Sq Ft
$886/Sq Ft
Est. Value
About This Home
This home is located at 306 6th St, Petaluma, CA 94952 and is currently estimated at $817,171, approximately $886 per square foot. 306 6th St is a home located in Sonoma County with nearby schools including McNear Elementary School, Petaluma Junior High School, and Petaluma High School.
Ownership History
Date
Name
Owned For
Owner Type
Purchase Details
Closed on
May 1, 2023
Sold by
Carlsen John Steven and Carlsen Christina M
Bought by
Carlsen-Raes Family Trust
Current Estimated Value
Purchase Details
Closed on
Jul 11, 2016
Sold by
Deremer Carol Elaine
Bought by
Deremer James C and Deremer Carol E
Purchase Details
Closed on
Jun 27, 2013
Sold by
Carlsen John Steven and De Remer Carol Elaine
Bought by
Carlsen John Steven and Deremer Carol Elaine
Purchase Details
Closed on
Nov 17, 1994
Sold by
Carlsen John I and Carlsen Geraldine I
Bought by
Carlsen John I and Carlsen Geraldine I
Create a Home Valuation Report for This Property
The Home Valuation Report is an in-depth analysis detailing your home's value as well as a comparison with similar homes in the area
Home Values in the Area
Average Home Value in this Area
Purchase History
| Date | Buyer | Sale Price | Title Company |
|---|---|---|---|
| Carlsen-Raes Family Trust | -- | None Listed On Document | |
| Deremer James C | -- | None Available | |
| Carlsen John Steven | -- | None Available | |
| Carlsen John I | -- | -- |
Source: Public Records
Tax History
| Year | Tax Paid | Tax Assessment Tax Assessment Total Assessment is a certain percentage of the fair market value that is determined by local assessors to be the total taxable value of land and additions on the property. | Land | Improvement |
|---|---|---|---|---|
| 2025 | $691 | $43,109 | $19,107 | $24,002 |
| 2024 | $691 | $42,265 | $18,733 | $23,532 |
| 2023 | $691 | $41,437 | $18,366 | $23,071 |
| 2022 | $592 | $40,625 | $18,006 | $22,619 |
| 2021 | $584 | $39,829 | $17,653 | $22,176 |
| 2020 | $588 | $39,421 | $17,472 | $21,949 |
| 2019 | $582 | $38,649 | $17,130 | $21,519 |
| 2018 | $581 | $37,893 | $16,795 | $21,098 |
| 2017 | $571 | $37,151 | $16,466 | $20,685 |
| 2016 | $550 | $36,424 | $16,144 | $20,280 |
| 2015 | $544 | $35,878 | $15,902 | $19,976 |
| 2014 | $542 | $35,176 | $15,591 | $19,585 |
Source: Public Records
Map
Nearby Homes
- 519 7th St
- 16 7th St
- 426 1st St
- 611 Petaluma Blvd S
- 816 B St
- 720 Petaluma Blvd S Unit 28
- 21 Branching Way
- 131 Liberty St
- 136 Court St
- 1309 D Street Extension
- 0 Lakeville St
- 315 Lakeville St
- 301 Broadway St
- 1028 Addison Cir
- 100 Orchard Ln
- 28 Meadowglen Dr
- 712 Oak Terrace
- 1193 Brighton View Cir
- 331 Keller St Unit 6
- 320 Vallejo St
Your Personal Tour Guide
Ask me questions while you tour the home.