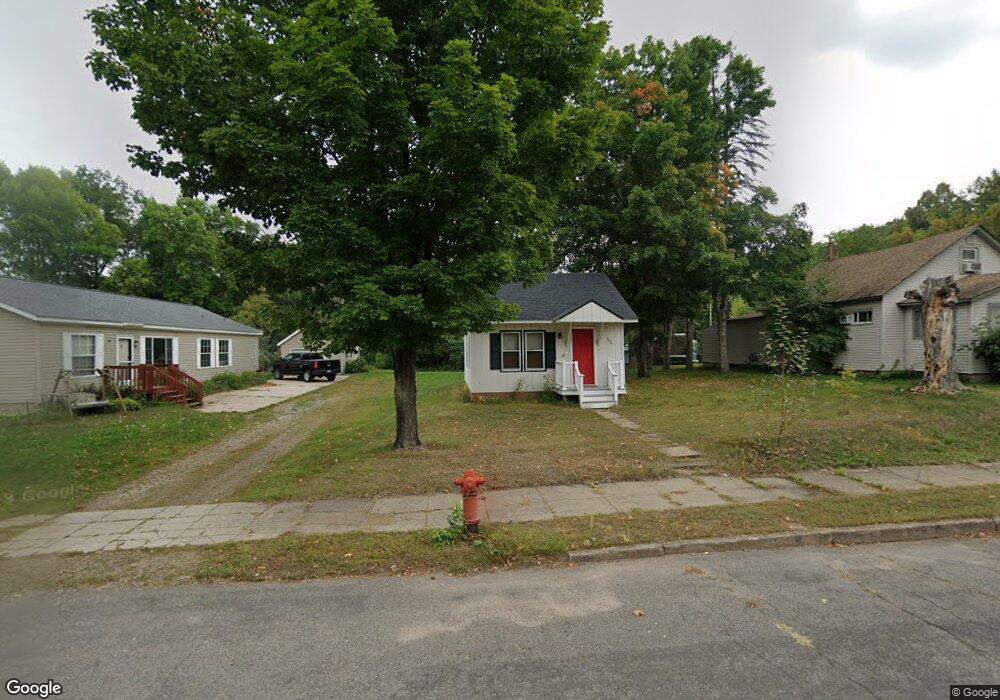
306 Cedar St S Onamia, MN 56359
Estimated Value: $101,273 - $121,000
2
Beds
1
Bath
656
Sq Ft
$170/Sq Ft
Est. Value
About This Home
This home is located at 306 Cedar St S, Onamia, MN 56359 and is currently estimated at $111,568, approximately $170 per square foot. 306 Cedar St S is a home located in Mille Lacs County with nearby schools including Onamia Secondary School.
Ownership History
Date
Name
Owned For
Owner Type
Purchase Details
Closed on
Mar 6, 2019
Sold by
Becker Daniel and Becker Mary
Bought by
Allison Brink Sonia
Current Estimated Value
Home Financials for this Owner
Home Financials are based on the most recent Mortgage that was taken out on this home.
Original Mortgage
$70,695
Outstanding Balance
$61,932
Interest Rate
4.62%
Mortgage Type
FHA
Estimated Equity
$49,636
Purchase Details
Closed on
Oct 13, 2018
Sold by
Becker Daniel Gilbert
Bought by
Becker Daniel Joseph
Purchase Details
Closed on
Aug 19, 2011
Sold by
Raaf Bonnie J
Bought by
Knudson Kurt M
Purchase Details
Closed on
Apr 22, 2010
Sold by
Usa Housing Fund Llc
Bought by
Raaf Bonnie J
Purchase Details
Closed on
Mar 19, 2010
Sold by
Federal National Mortgage Association
Bought by
Usa Housing Fund Llc
Purchase Details
Closed on
Jun 25, 2009
Sold by
Harder Sue M
Bought by
Washington Mutual Bank Fa
Create a Home Valuation Report for This Property
The Home Valuation Report is an in-depth analysis detailing your home's value as well as a comparison with similar homes in the area
Purchase History
| Date | Buyer | Sale Price | Title Company |
|---|---|---|---|
| Allison Brink Sonia | $72,000 | North American Title | |
| Becker Daniel Joseph | -- | None Available | |
| Knudson Kurt M | -- | East Central Title | |
| Raaf Bonnie J | $10,900 | Real Estate Title Inc | |
| Usa Housing Fund Llc | -- | First Financial Title Agency | |
| Washington Mutual Bank Fa | $47,260 | None Available |
Source: Public Records
Mortgage History
| Date | Status | Borrower | Loan Amount |
|---|---|---|---|
| Open | Allison Brink Sonia | $70,695 |
Source: Public Records
Tax History
| Year | Tax Paid | Tax Assessment Tax Assessment Total Assessment is a certain percentage of the fair market value that is determined by local assessors to be the total taxable value of land and additions on the property. | Land | Improvement |
|---|---|---|---|---|
| 2025 | $1,578 | $81,100 | $22,500 | $58,600 |
| 2024 | $1,562 | $98,000 | $21,600 | $76,400 |
| 2023 | $1,484 | $103,000 | $21,600 | $81,400 |
| 2022 | $1,468 | $91,700 | $17,500 | $74,200 |
| 2021 | $1,114 | $79,100 | $17,500 | $61,600 |
| 2020 | $638 | $59,900 | $12,500 | $47,400 |
| 2019 | $626 | $50,600 | $12,300 | $38,300 |
| 2018 | $550 | $51,200 | $12,300 | $38,900 |
| 2017 | $766 | $45,600 | $11,700 | $33,900 |
| 2016 | $700 | $0 | $0 | $0 |
| 2015 | $698 | $0 | $0 | $0 |
| 2014 | $698 | $0 | $0 | $0 |
Source: Public Records
Map
Nearby Homes
- 611 Kathio St
- 102 Birch St S
- XXX State Hwy 169
- 12083 350th St
- 34321 Us Highway 169
- 35455 100th Ave
- 35xxx 100th Ave
- XXX Highway 169
- Tbd Tamarac Rd
- TBD-1 330th St
- TBD-2 330th St
- XXX 330th St
- TBD Tamarac Rd
- 9736 State Highway 27
- XXX Stevens Rd
- 11084 320th St
- xxx 360th St
- TBD Summit Rd
- TBD 360th St
- 13001 Twilight Rd
- 306 Cedar St S
- 306 Cedar St S
- 304 Cedar St S
- 304 Cedar St S
- 304 Roosevelt Rd S
- 310 Cedar St S
- 310 Cedar St S
- 302 Roosevelt Rd S
- 301 Cedar St S
- 301 Cedar St S
- 407 Railroad Ave W
- 300 Roosevelt Rd S
- 308 Roosevelt Rd S
- 401 Railroad Ave W
- 300 Pine St S
- 310 Roosevelt Rd S
- 316 Pine St S
- 313 Oak St S
- XX6 Sugar Bush Cir
- xx4 Sugar Bush Cir
Your Personal Tour Guide
Ask me questions while you tour the home.