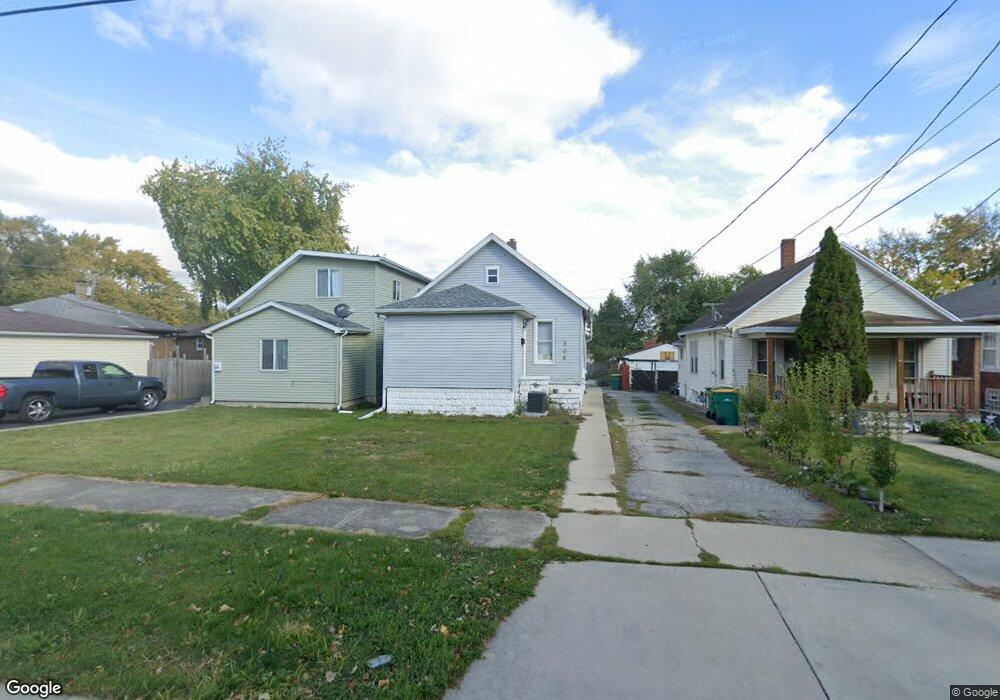
306 Comstock St Joliet, IL 60436
Saint Pat's NeighborhoodEstimated Value: $159,000 - $209,000
2
Beds
2
Baths
1,076
Sq Ft
$172/Sq Ft
Est. Value
About This Home
This home is located at 306 Comstock St, Joliet, IL 60436 and is currently estimated at $184,579, approximately $171 per square foot. 306 Comstock St is a home located in Will County with nearby schools including Pershing Elementary School, Dirksen Junior High School, and Joliet Central High School.
Ownership History
Date
Name
Owned For
Owner Type
Purchase Details
Closed on
May 7, 2024
Sold by
Grigus Frank J and Grigus Lauren C
Bought by
One4 Holdings Llc
Current Estimated Value
Purchase Details
Closed on
Nov 29, 2017
Sold by
Cbg Assest Management Llc
Bought by
Grigus Frank J and Grigus Lauren C
Purchase Details
Closed on
Sep 27, 2017
Sold by
Greystone Fund Llc
Bought by
Cbg Asset Management Llc
Purchase Details
Closed on
Jul 29, 2015
Sold by
Aguilera Socorro and Case#13 Ch 3428
Bought by
Greytorreys Fund Llc
Purchase Details
Closed on
Jun 18, 2015
Sold by
Aguilera Socorro and Padilla Pedro M
Bought by
Graytorreys Fund Llc and Custom Servicing Llc
Purchase Details
Closed on
Jul 27, 2004
Sold by
Aguilera Socorro
Bought by
Aguilera Socorro and Padilla Pedro M
Purchase Details
Closed on
May 27, 2003
Sold by
Alvarado Edmundo
Bought by
Aguilera Socorro
Purchase Details
Closed on
Aug 24, 1993
Bought by
Aguilera Socorro
Create a Home Valuation Report for This Property
The Home Valuation Report is an in-depth analysis detailing your home's value as well as a comparison with similar homes in the area
Home Values in the Area
Average Home Value in this Area
Purchase History
| Date | Buyer | Sale Price | Title Company |
|---|---|---|---|
| One4 Holdings Llc | $150,000 | Fidelity National Title | |
| Grigus Frank J | $61,500 | Chicago Title | |
| Cbg Asset Management Llc | $42,000 | Carrington Title Partners Ll | |
| Greytorreys Fund Llc | -- | Attorney | |
| Graytorreys Fund Llc | $62,526 | Attorney | |
| Aguilera Socorro | -- | Chicago Title Insurance Co | |
| Aguilera Socorro | -- | Chicago Title Insurance Comp | |
| Aguilera Socorro | $63,000 | -- |
Source: Public Records
Tax History Compared to Growth
Tax History
| Year | Tax Paid | Tax Assessment Tax Assessment Total Assessment is a certain percentage of the fair market value that is determined by local assessors to be the total taxable value of land and additions on the property. | Land | Improvement |
|---|---|---|---|---|
| 2024 | $4,330 | $51,700 | $6,207 | $45,493 |
| 2023 | $4,330 | $45,935 | $5,515 | $40,420 |
| 2022 | $3,837 | $41,552 | $4,989 | $36,563 |
| 2021 | $3,647 | $38,809 | $4,660 | $34,149 |
| 2020 | $3,460 | $36,855 | $4,425 | $32,430 |
| 2019 | $3,291 | $34,251 | $4,112 | $30,139 |
| 2018 | $3,061 | $30,717 | $3,666 | $27,051 |
| 2017 | $2,885 | $27,927 | $3,333 | $24,594 |
| 2016 | $2,705 | $25,170 | $3,040 | $22,130 |
| 2015 | $1,943 | $23,600 | $2,850 | $20,750 |
| 2014 | $1,943 | $23,500 | $2,850 | $20,650 |
| 2013 | $1,943 | $25,594 | $3,193 | $22,401 |
Source: Public Records
Map
Nearby Homes
- 324 Illinois St
- 310 Pleasant St
- 508 Mcdonough St
- 411 Pleasant St
- 614 Darcy Ave
- 104 Seeser St
- 17 S Cagwin Ave
- 800 W Park Ave
- 8 Ivy St
- 167 Wallace St
- 457 S Desplaines St
- 304 S Desplaines St
- 4 Blackman Ave
- 805 Grand Blvd
- 454 S Desplaines St
- 305 S Joliet St
- 810 W Marion St
- 900 Jasper St
- 818 Cochrane Ave
- 611 Richmond St
- 304 Comstock St
- 308 Comstock St
- 310 Comstock St
- 307 Hyde Park St
- 309 Hyde Park St
- 506 Morgan St
- 312 Comstock St
- 311 Hyde Park St
- 504 Morgan St
- 508 Morgan St
- 305 Hyde Park St
- 313 Hyde Park St
- 305 Comstock St
- 301 Hyde Park St
- 315 Hyde Park St
- 307 S Comstock St
- 301 Comstock St
- 307 Comstock St
- 514 Morgan St
- 311 S Comstock St