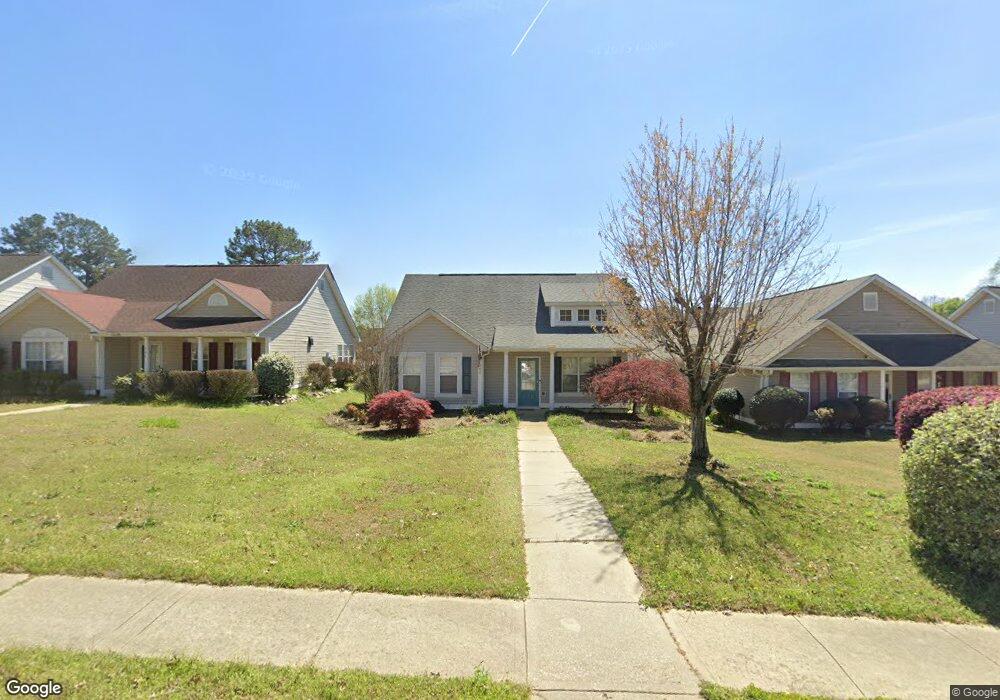
306 Fairdale Trace Stockbridge, GA 30281
Estimated Value: $265,574 - $290,000
3
Beds
2
Baths
1,446
Sq Ft
$194/Sq Ft
Est. Value
About This Home
This home is located at 306 Fairdale Trace, Stockbridge, GA 30281 and is currently estimated at $279,894, approximately $193 per square foot. 306 Fairdale Trace is a home located in Henry County with nearby schools including Red Oak Elementary School, Dutchtown Middle School, and Dutchtown High School.
Ownership History
Date
Name
Owned For
Owner Type
Purchase Details
Closed on
Jul 21, 2020
Sold by
Sfr Jv 1 Property Llc
Bought by
Sfr Jv 1 2020 1 Borrower Llc
Current Estimated Value
Purchase Details
Closed on
Nov 12, 2019
Sold by
Opendoor Property Trust I
Bought by
Sfr Jv 1 Property Llc
Purchase Details
Closed on
Oct 21, 2019
Sold by
Ballard Troy Jerome
Bought by
Opendoor Property Trust I
Purchase Details
Closed on
Mar 29, 2018
Sold by
Brooks Dianne E
Bought by
Ballard Troy Jerome and Ballard Diane L
Home Financials for this Owner
Home Financials are based on the most recent Mortgage that was taken out on this home.
Original Mortgage
$152,500
Interest Rate
4.43%
Mortgage Type
VA
Purchase Details
Closed on
Aug 29, 2001
Sold by
Mckenzie-Perry Homes Inc
Bought by
Brooks Dianne E
Home Financials for this Owner
Home Financials are based on the most recent Mortgage that was taken out on this home.
Original Mortgage
$107,350
Interest Rate
6.87%
Mortgage Type
New Conventional
Create a Home Valuation Report for This Property
The Home Valuation Report is an in-depth analysis detailing your home's value as well as a comparison with similar homes in the area
Home Values in the Area
Average Home Value in this Area
Purchase History
| Date | Buyer | Sale Price | Title Company |
|---|---|---|---|
| Sfr Jv 1 2020 1 Borrower Llc | -- | -- | |
| Sfr Jv 1 Property Llc | $170,000 | -- | |
| Opendoor Property Trust I | $170,700 | -- | |
| Ballard Troy Jerome | $152,500 | -- | |
| Brooks Dianne E | $134,300 | -- |
Source: Public Records
Mortgage History
| Date | Status | Borrower | Loan Amount |
|---|---|---|---|
| Previous Owner | Ballard Troy Jerome | $152,500 | |
| Previous Owner | Brooks Dianne E | $107,350 |
Source: Public Records
Tax History Compared to Growth
Tax History
| Year | Tax Paid | Tax Assessment Tax Assessment Total Assessment is a certain percentage of the fair market value that is determined by local assessors to be the total taxable value of land and additions on the property. | Land | Improvement |
|---|---|---|---|---|
| 2025 | $4,854 | $112,720 | $18,000 | $94,720 |
| 2024 | $4,854 | $116,560 | $18,000 | $98,560 |
| 2023 | $5,026 | $119,040 | $14,000 | $105,040 |
| 2022 | $3,811 | $93,720 | $14,000 | $79,720 |
| 2021 | $3,106 | $75,200 | $12,000 | $63,200 |
| 2020 | $2,832 | $68,000 | $9,928 | $58,072 |
| 2019 | $2,503 | $61,000 | $9,638 | $51,362 |
| 2018 | $1,669 | $58,960 | $10,000 | $48,960 |
| 2016 | $1,672 | $46,400 | $10,000 | $36,400 |
| 2015 | $1,522 | $41,640 | $7,200 | $34,440 |
| 2014 | $1,289 | $35,480 | $6,400 | $29,080 |
Source: Public Records
Map
Nearby Homes
- 266 Monarch Village Way
- 687 Pathwood Ln
- 602 Brookwater Dr
- 623 Brookwater Dr
- 300 Monarch Village Way
- 520 Monarch Lake Way
- 540 Anglewood Trace
- 591 Creek Valley Ct
- 3916 Champagne Dr
- 512 Chaucer Way Unit 1
- 719 Nightwind Way
- 213 Sunderland Way Unit 1
- 117 Titan Rd
- 1341 Kent Manor Unit 3
- 1653 Jersey Dr
- 1545 Brangus Dr
- 568 Ransom Way
- 4025 Jamaica Dr
- 308 Fairdale Trace Unit 68
- 308 Fairdale Trace
- 304 Fairdale Trace
- 310 Fairdale Trace
- 302 Fairdale Trace
- 302 Fairdale Trace Unit UK
- 312 Fairdale Trace
- 259 Monarch Village Way
- 257 Monarch Village Way
- 307 Fairdale Trace
- 305 Fairdale Trace
- 261 Monarch Village Way
- 309 Fairdale Trace
- 233 Monarch Village Way
- 314 Fairdale Trace
- 311 Fairdale Trace
- 303 Fairdale Trace
- 303 Fairdale Trace Unit 3
- 255 Monarch Village Way
- 263 Monarch Village Way