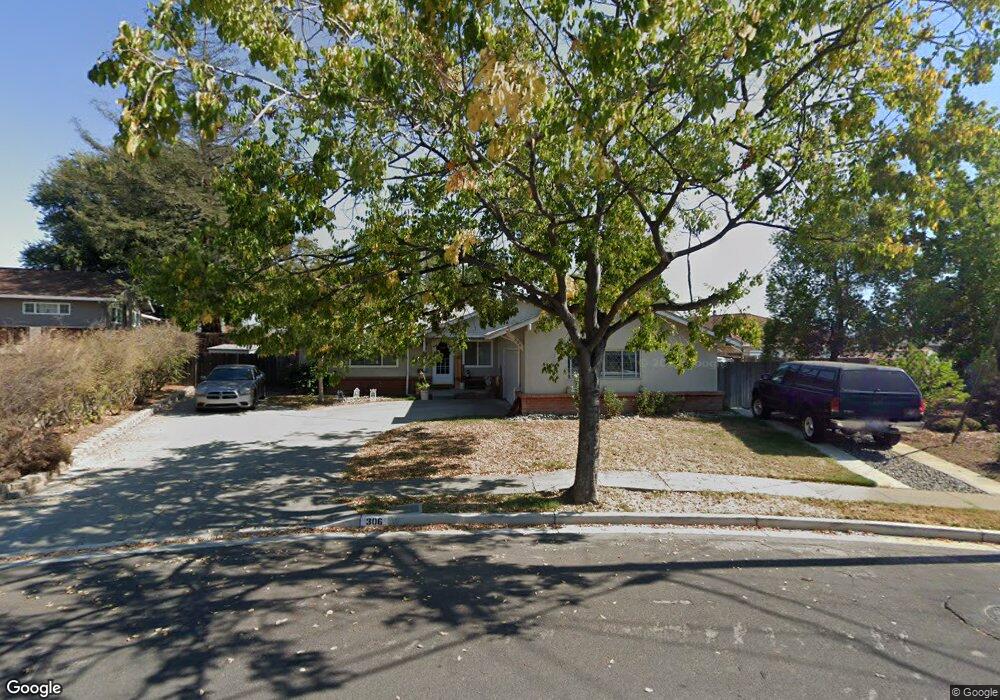
306 Michell St Livermore, CA 94551
Portola Glen NeighborhoodEstimated Value: $867,000 - $1,000,000
3
Beds
2
Baths
1,350
Sq Ft
$693/Sq Ft
Est. Value
About This Home
This home is located at 306 Michell St, Livermore, CA 94551 and is currently estimated at $935,231, approximately $692 per square foot. 306 Michell St is a home located in Alameda County with nearby schools including Junction Avenue K-8 School, Livermore High School, and Valley Montessori School.
Ownership History
Date
Name
Owned For
Owner Type
Purchase Details
Closed on
Aug 30, 2001
Sold by
Bailey David Charles and Bailey Kelly
Bought by
Tonowski James M and Tonowski Michele
Current Estimated Value
Home Financials for this Owner
Home Financials are based on the most recent Mortgage that was taken out on this home.
Original Mortgage
$272,000
Outstanding Balance
$106,529
Interest Rate
7.05%
Estimated Equity
$828,702
Purchase Details
Closed on
Oct 14, 1998
Sold by
Zimmerman Robert C
Bought by
Bailey David Charles and Bailey Kelly
Home Financials for this Owner
Home Financials are based on the most recent Mortgage that was taken out on this home.
Original Mortgage
$202,980
Interest Rate
6.6%
Mortgage Type
VA
Create a Home Valuation Report for This Property
The Home Valuation Report is an in-depth analysis detailing your home's value as well as a comparison with similar homes in the area
Home Values in the Area
Average Home Value in this Area
Purchase History
| Date | Buyer | Sale Price | Title Company |
|---|---|---|---|
| Tonowski James M | $340,000 | North American Title Co | |
| Bailey David Charles | $203,000 | Chicago Title Co |
Source: Public Records
Mortgage History
| Date | Status | Borrower | Loan Amount |
|---|---|---|---|
| Open | Tonowski James M | $272,000 | |
| Previous Owner | Bailey David Charles | $202,980 | |
| Closed | Tonowski James M | $51,000 |
Source: Public Records
Tax History
| Year | Tax Paid | Tax Assessment Tax Assessment Total Assessment is a certain percentage of the fair market value that is determined by local assessors to be the total taxable value of land and additions on the property. | Land | Improvement |
|---|---|---|---|---|
| 2025 | $6,656 | $495,247 | $150,674 | $351,573 |
| 2024 | $6,656 | $485,401 | $147,720 | $344,681 |
| 2023 | $6,549 | $482,748 | $144,824 | $337,924 |
| 2022 | $6,447 | $466,283 | $141,985 | $331,298 |
| 2021 | $5,567 | $457,004 | $139,201 | $324,803 |
| 2020 | $6,120 | $459,247 | $137,774 | $321,473 |
| 2019 | $6,139 | $450,244 | $135,073 | $315,171 |
| 2018 | $6,001 | $441,418 | $132,425 | $308,993 |
| 2017 | $5,841 | $432,764 | $129,829 | $302,935 |
| 2016 | $5,617 | $424,281 | $127,284 | $296,997 |
| 2015 | $5,274 | $417,910 | $125,373 | $292,537 |
| 2014 | $5,180 | $409,727 | $122,918 | $286,809 |
Source: Public Records
Map
Nearby Homes
- 3370 Gardella Plaza
- 112 Martin Ave
- 2840 Salt Pond Common
- 3473 Edinburgh Dr
- 2840 Waverley Way
- 3873 Inverness Common
- 984 Waverly Common
- 3959 Purdue Way
- 2155 Chestnut St
- 350 N K St
- 317 Hillcrest Ave
- 0 N K St
- 4128 Camrose Ave
- 3992 Yale Way
- 865 Bower Ct
- 2235 4th St
- 3910 East Ave
- 560 N M St
- 1861 Linden St
- 157 Zephyr Place Unit 109
- 314 Michell Ct
- 292 Michell St
- 312 Michell Ct
- 3370 Gardella Plaza Unit Room 2
- 3370 Gardella Plaza Unit Room 4
- 3370 Gardella Plaza Unit Room 3
- 3370 Gardella Plaza Unit Room 7
- 320 Michell Ct
- 309 Michell St
- 286 Michell St
- 315 Michell St
- 3366 Gardella Plaza
- 322 Michell Ct
- 321 Michell St
- 318 Martin Ave
- 264 Martin Ave
- 332 Michell Ct
- 307 Scott St
- 330 Michell Ct
- 3368 Gardella Plaza
Your Personal Tour Guide
Ask me questions while you tour the home.