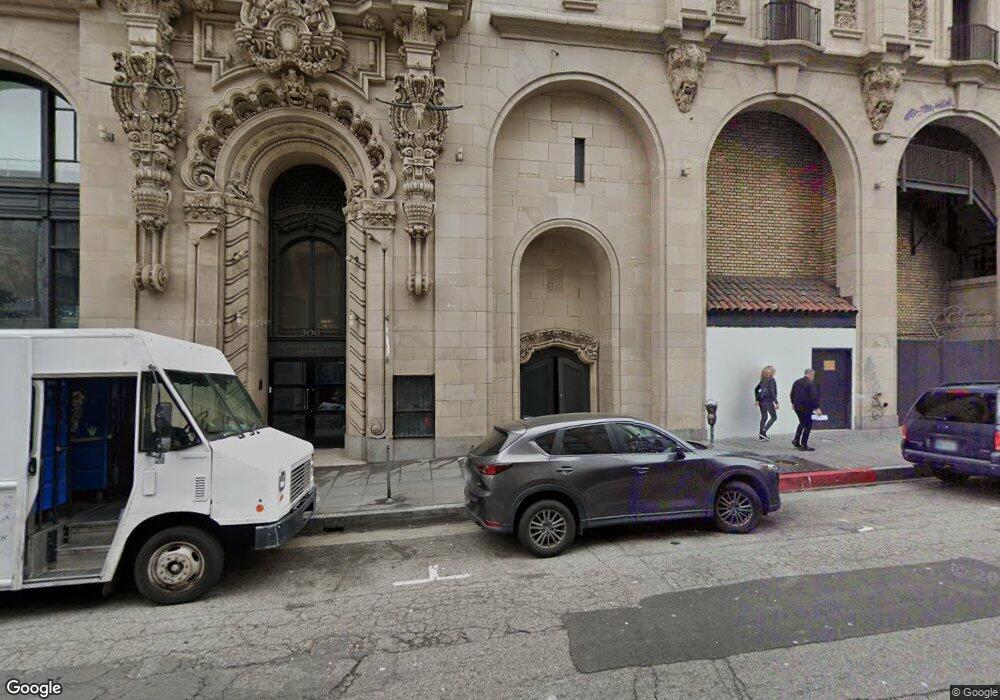
306 W 3rd St Unit 880 Los Angeles, CA 90013
Downtown LA NeighborhoodEstimated Value: $1,257,000 - $1,457,000
8
Beds
8
Baths
4,534
Sq Ft
$294/Sq Ft
Est. Value
About This Home
This home is located at 306 W 3rd St Unit 880, Los Angeles, CA 90013 and is currently estimated at $1,333,333, approximately $294 per square foot. 306 W 3rd St Unit 880 is a home located in Los Angeles County with nearby schools including Para Los Niños Charter Middle School, John H. Liechty Middle School, and Ramón C. Cortines School of Visual and Performing Arts.
Ownership History
Date
Name
Owned For
Owner Type
Purchase Details
Closed on
Oct 28, 2003
Sold by
Guh Lupe Vanessa
Bought by
Guh Lupe Vanessa
Current Estimated Value
Home Financials for this Owner
Home Financials are based on the most recent Mortgage that was taken out on this home.
Original Mortgage
$99,193
Interest Rate
5.98%
Mortgage Type
Stand Alone First
Purchase Details
Closed on
Oct 31, 2002
Sold by
Guh Nae Gung
Bought by
Guh Lupe Vanessa
Purchase Details
Closed on
Jul 29, 1997
Sold by
World S & L Assn Fsla
Bought by
Guh Nae Gung and Guh Lupe Vanessa
Home Financials for this Owner
Home Financials are based on the most recent Mortgage that was taken out on this home.
Original Mortgage
$252,025
Outstanding Balance
$37,909
Interest Rate
7.58%
Mortgage Type
Seller Take Back
Estimated Equity
$1,295,424
Purchase Details
Closed on
Jan 3, 1997
Sold by
Milutin Boris and World Sl & Assn Fsla
Bought by
World S & L Assn Fsla
Create a Home Valuation Report for This Property
The Home Valuation Report is an in-depth analysis detailing your home's value as well as a comparison with similar homes in the area
Home Values in the Area
Average Home Value in this Area
Purchase History
| Date | Buyer | Sale Price | Title Company |
|---|---|---|---|
| Guh Lupe Vanessa | -- | Chicago Title Co | |
| Guh Lupe Vanessa | -- | First American | |
| Guh Nae Gung | $296,500 | Fidelity National Title Co | |
| World S & L Assn Fsla | $295,000 | Stewart Title |
Source: Public Records
Mortgage History
| Date | Status | Borrower | Loan Amount |
|---|---|---|---|
| Closed | Guh Lupe Vanessa | $99,193 | |
| Open | Guh Nae Gung | $252,025 |
Source: Public Records
Tax History Compared to Growth
Tax History
| Year | Tax Paid | Tax Assessment Tax Assessment Total Assessment is a certain percentage of the fair market value that is determined by local assessors to be the total taxable value of land and additions on the property. | Land | Improvement |
|---|---|---|---|---|
| 2025 | $6,233 | $473,409 | $253,868 | $219,541 |
| 2024 | $6,233 | $464,128 | $248,891 | $215,237 |
| 2023 | $6,123 | $455,028 | $244,011 | $211,017 |
| 2022 | $5,855 | $446,107 | $239,227 | $206,880 |
| 2021 | $5,762 | $437,361 | $234,537 | $202,824 |
| 2019 | $5,599 | $424,391 | $227,582 | $196,809 |
| 2018 | $5,459 | $416,070 | $223,120 | $192,950 |
| 2017 | $5,346 | $407,913 | $218,746 | $189,167 |
| 2016 | $5,178 | $399,915 | $214,457 | $185,458 |
| 2015 | $5,107 | $393,909 | $211,236 | $182,673 |
| 2014 | $5,148 | $386,194 | $207,099 | $179,095 |
Source: Public Records
Map
Nearby Homes
- 253 S Broadway Unit 507
- 257 S Spring St Unit 3C
- 400 S Broadway Unit 828
- 400 S Broadway Unit 502
- 400 S Broadway Unit 1504
- 400 S Broadway Unit 3106
- 400 S Broadway Unit 2101
- 400 S Broadway Unit 1702
- 400 S Broadway Unit 1012
- 400 S Broadway Unit 1001
- 400 S Broadway Unit 1202
- 400 S Broadway Unit 917
- 400 S Broadway Unit 911
- 400 S Broadway Unit 3109
- 400 S Broadway Unit 606
- 400 S Broadway Unit 2504
- 400 S Broadway Unit 2304
- 424 S Broadway
- 416 S Spring St Unit 505
- 416 S Spring St Unit 1109
- 306 W 3rd St
- 306 W 3rd St
- 306 W 3rd St Unit 823
- 306 W 3rd St Unit 829
- 306 W 3rd St Unit 835
- 306 W 3rd St Unit 841
- 306 W 3rd St Unit 843
- 306 W 3rd St Unit 853
- 306 W 3rd St Unit 861
- 306 W 3rd St Unit 867
- 306 W 3rd St Unit 873
- 306 W 3rd St Unit 879
- 306 W 3rd St Unit 885
- 306 W 3rd St Unit 535
- 306 W 3rd St Unit 541
- 306 W 3rd St Unit 545
- 306 W 3rd St Unit 555
- 306 W 3rd St Unit 561
- 306 W 3rd St Unit 567
- 306 W 3rd St Unit 573