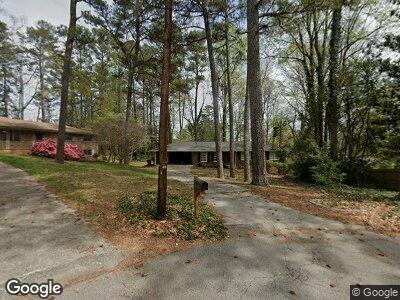
3060 Norton Ct SE Smyrna, GA 30082
Estimated Value: $331,570 - $425,000
3
Beds
2
Baths
1,425
Sq Ft
$265/Sq Ft
Est. Value
About This Home
This home is located at 3060 Norton Ct SE, Smyrna, GA 30082 and is currently estimated at $378,143, approximately $265 per square foot. 3060 Norton Ct SE is a home located in Cobb County with nearby schools including Norton Park Elementary School, Griffin Middle School, and Campbell High School.
Ownership History
Date
Name
Owned For
Owner Type
Purchase Details
Closed on
Dec 13, 2017
Sold by
Layden Tiffany Wise
Bought by
Layden Tiffany Wise and Layden John Gregory
Current Estimated Value
Purchase Details
Closed on
May 28, 2010
Sold by
Hooks Ryan H and Hooks Allison B
Bought by
Wise Tiffany A
Home Financials for this Owner
Home Financials are based on the most recent Mortgage that was taken out on this home.
Original Mortgage
$149,980
Interest Rate
5.5%
Mortgage Type
FHA
Purchase Details
Closed on
Jan 25, 2002
Sold by
Brown David A
Bought by
Hooks Ryan H and Hooks Allison B
Home Financials for this Owner
Home Financials are based on the most recent Mortgage that was taken out on this home.
Original Mortgage
$145,350
Interest Rate
7.16%
Mortgage Type
New Conventional
Purchase Details
Closed on
Sep 11, 2001
Sold by
Ewing Charles G and Ewing Geralyn S
Bought by
Brown David A
Create a Home Valuation Report for This Property
The Home Valuation Report is an in-depth analysis detailing your home's value as well as a comparison with similar homes in the area
Home Values in the Area
Average Home Value in this Area
Purchase History
| Date | Buyer | Sale Price | Title Company |
|---|---|---|---|
| Layden Tiffany Wise | -- | -- | |
| Wise Tiffany A | $152,000 | -- | |
| Hooks Ryan H | $153,000 | -- | |
| Brown David A | $147,000 | -- |
Source: Public Records
Mortgage History
| Date | Status | Borrower | Loan Amount |
|---|---|---|---|
| Previous Owner | Layden Tiffany Wise | $137,000 | |
| Previous Owner | Wise Tiffany A | $149,980 | |
| Previous Owner | Hooks Ryan H | $150,800 | |
| Previous Owner | Hooks Ryan H | $145,350 |
Source: Public Records
Tax History Compared to Growth
Tax History
| Year | Tax Paid | Tax Assessment Tax Assessment Total Assessment is a certain percentage of the fair market value that is determined by local assessors to be the total taxable value of land and additions on the property. | Land | Improvement |
|---|---|---|---|---|
| 2024 | $3,705 | $149,348 | $36,000 | $113,348 |
| 2023 | $2,393 | $113,892 | $18,400 | $95,492 |
| 2022 | $2,957 | $113,892 | $18,400 | $95,492 |
| 2021 | $2,477 | $91,980 | $18,400 | $73,580 |
| 2020 | $2,644 | $87,120 | $18,400 | $68,720 |
| 2019 | $2,260 | $74,480 | $18,400 | $56,080 |
| 2018 | $1,859 | $61,260 | $18,400 | $42,860 |
| 2017 | $1,761 | $61,260 | $18,400 | $42,860 |
| 2016 | $1,670 | $58,084 | $18,400 | $39,684 |
| 2015 | $1,711 | $58,084 | $18,400 | $39,684 |
| 2014 | $1,726 | $58,084 | $0 | $0 |
Source: Public Records
Map
Nearby Homes
- 3216 Woodview Dr SE
- 218 Woodview Ln SE
- 3215 Woodview Dr SE
- 243 Woodview Ln SE
- 283 Norton Cir SE
- 43 Landmark Ln SW
- 339 Diane Dr SE
- 151 Mark Ln SE
- 2898 Lakemont Dr SW
- 358 Nature Brook Walk SE
- 2896 Lakemont Dr SW
- 2923 Hall Dr SE
- 1368 Poplar Pointe SE
- 4710 Vineyard Ct SE
- 1118 Magnolia Way SE
- 209 Courtland Oaks Dr SW
- 2746 Sanibel Ln SE
- 2880 Hall Dr SE
- 3060 Norton Ct SE
- 3070 Norton Ct SE
- 3010 Norton Ct SE
- 570 Norton Cir SE
- 3071 Norton Ct SE
- 0 Norton Ct SE Unit 7273958
- 0 Norton Ct SE Unit 7091707
- 0 Norton Ct SE Unit 8849434
- 0 Norton Ct SE Unit 8577669
- 0 Norton Ct SE Unit 8248524
- 0 Norton Ct SE Unit 8670604
- 0 Norton Ct SE Unit 8586412
- 0 Norton Ct SE Unit 7048510
- 0 Norton Ct SE Unit 3199352
- 0 Norton Ct SE
- 580 Norton Cir SE
- 560 Norton Cir SE
- 3051 Norton Ct SE
- 3021 Norton Ct SE
- 3011 Norton Ct SE Unit 8