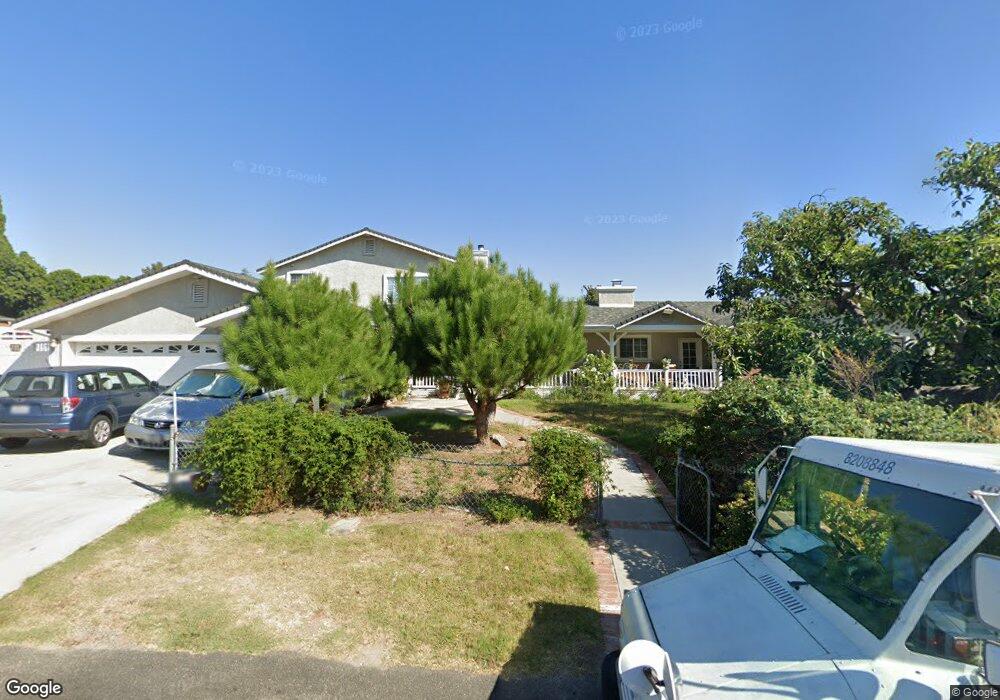
3062 Reservoir Dr Simi Valley, CA 93065
Central Simi Valley NeighborhoodEstimated Value: $1,324,000 - $1,863,000
6
Beds
4
Baths
4,432
Sq Ft
$347/Sq Ft
Est. Value
About This Home
This home is located at 3062 Reservoir Dr, Simi Valley, CA 93065 and is currently estimated at $1,536,974, approximately $346 per square foot. 3062 Reservoir Dr is a home located in Ventura County with nearby schools including Sycamore Elementary School, Valley View Middle School, and Simi Valley High School.
Ownership History
Date
Name
Owned For
Owner Type
Purchase Details
Closed on
Mar 14, 2000
Sold by
Guy Ken R and Guy Margaret L
Bought by
Guy Kenneth and Guy Margaret
Current Estimated Value
Purchase Details
Closed on
Jun 26, 1998
Sold by
Bozarth Linda A and Bozarth Sharon M
Bought by
Guy Ken R and Guy Margaret L
Purchase Details
Closed on
Jun 21, 1994
Sold by
Bozarth Linda Ann and Jones Malone Sharon M
Bought by
Bozarth Linda Ann and Jones Malone Sharon M
Home Financials for this Owner
Home Financials are based on the most recent Mortgage that was taken out on this home.
Original Mortgage
$327,750
Interest Rate
6.75%
Purchase Details
Closed on
May 6, 1994
Sold by
Simms Russell C and Simms Lisa M
Bought by
Bozarth Linda Ann and Jones Malone Sharon M
Home Financials for this Owner
Home Financials are based on the most recent Mortgage that was taken out on this home.
Original Mortgage
$327,750
Interest Rate
6.75%
Create a Home Valuation Report for This Property
The Home Valuation Report is an in-depth analysis detailing your home's value as well as a comparison with similar homes in the area
Home Values in the Area
Average Home Value in this Area
Purchase History
| Date | Buyer | Sale Price | Title Company |
|---|---|---|---|
| Guy Kenneth | -- | -- | |
| Guy Ken R | $365,000 | First American Title Ins Co | |
| Bozarth Linda Ann | -- | Gateway Title Co | |
| Bozarth Linda Ann | $345,000 | Gateway Title Co |
Source: Public Records
Mortgage History
| Date | Status | Borrower | Loan Amount |
|---|---|---|---|
| Previous Owner | Bozarth Linda Ann | $327,750 |
Source: Public Records
Tax History Compared to Growth
Tax History
| Year | Tax Paid | Tax Assessment Tax Assessment Total Assessment is a certain percentage of the fair market value that is determined by local assessors to be the total taxable value of land and additions on the property. | Land | Improvement |
|---|---|---|---|---|
| 2025 | $7,331 | $612,741 | $219,466 | $393,275 |
| 2024 | $7,331 | $600,727 | $215,163 | $385,564 |
| 2023 | $6,894 | $588,949 | $210,945 | $378,004 |
| 2022 | $6,876 | $577,401 | $206,808 | $370,593 |
| 2021 | $6,834 | $566,080 | $202,753 | $363,327 |
| 2020 | $6,698 | $560,277 | $200,675 | $359,602 |
| 2019 | $6,395 | $549,292 | $196,741 | $352,551 |
| 2018 | $6,347 | $538,523 | $192,884 | $345,639 |
| 2017 | $6,209 | $527,964 | $189,102 | $338,862 |
| 2016 | $5,933 | $517,613 | $185,395 | $332,218 |
| 2015 | $5,813 | $509,840 | $182,611 | $327,229 |
| 2014 | $5,736 | $499,855 | $179,035 | $320,820 |
Source: Public Records
Map
Nearby Homes
- 3049 Reservoir Dr
- 2877 Avenida Simi
- 3060 Bianca Cir
- 3262 Avenida Simi
- 2848 Jadestone Ave
- 3067 Harrison Ln
- 2649 Nicholas St
- 2753 Deerwood Ave
- 2679 Velma Ct
- 3010 Tallahassee Ln
- 2842 Topaz Ave
- 2671 Coral Gum Ln
- 2660 Tumbleweed Ave
- 3160 Leslie Ct
- 3298 Wisdom Ct
- 2885 Circle View Dr
- 3445 Presidio Ct
- 2718 Licia Place
- 2752 Wanda Ave
- 2719 Licia Place
- 2938 Happy Ln
- 3060 Reservoir Dr
- 3096 Reservoir Dr
- 3071 Reservoir Dr
- 3059 Reservoir Dr
- 2945 Happy Ln
- 3050 Reservoir Dr
- 2950 Happy Ln
- 2953 Avenida Simi
- 3106 Reservoir Dr
- 2871 Howe Rd
- 3109 Reservoir Dr
- 2868 Howe Rd
- 2959 Happy Ln
- 3033 Reservoir Dr
- 2985 Avenida Simi
- 3018 Reservoir Dr
- 2937 Avenida Simi
- 3132 Reservoir Dr
- 3115 Reservoir Dr