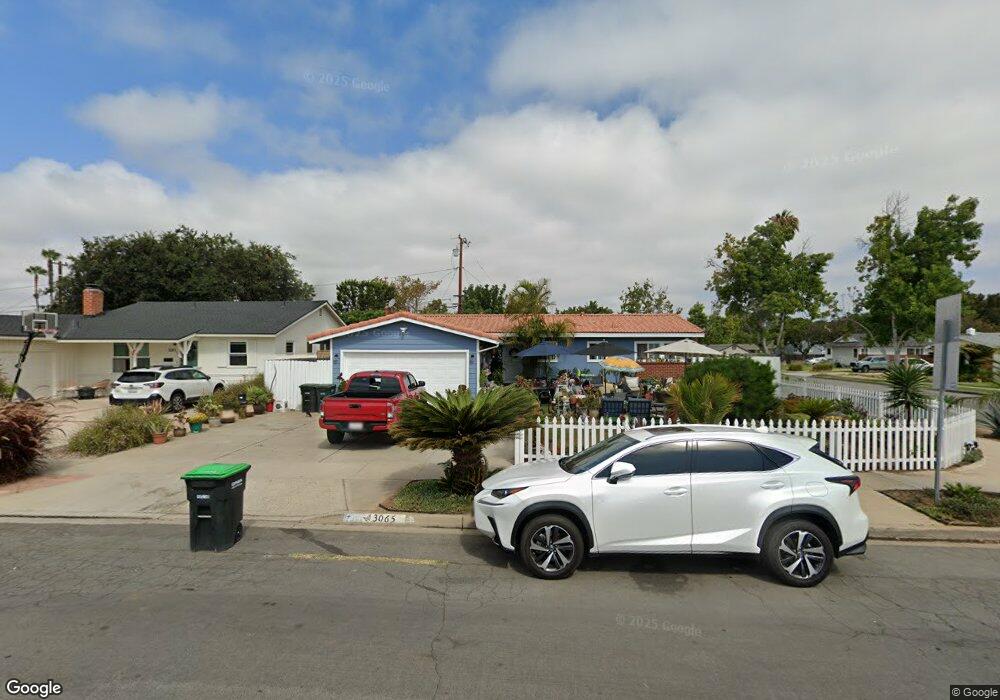
3065 Royce Ln Costa Mesa, CA 92626
Harbor Gateway NeighborhoodEstimated Value: $1,307,000 - $1,339,000
3
Beds
3
Baths
1,177
Sq Ft
$1,123/Sq Ft
Est. Value
About This Home
This home is located at 3065 Royce Ln, Costa Mesa, CA 92626 and is currently estimated at $1,321,303, approximately $1,122 per square foot. 3065 Royce Ln is a home located in Orange County with nearby schools including Killybrooke Elementary School, Costa Mesa High School, and Montessori Christian School.
Ownership History
Date
Name
Owned For
Owner Type
Purchase Details
Closed on
Nov 24, 2024
Sold by
Alatorre Lopez Ramon and Alatorre Sara Macias
Bought by
Macias Sara
Current Estimated Value
Purchase Details
Closed on
Aug 1, 2000
Sold by
Bishop Michael R
Bought by
Alatorre Ramon and Alatorre Sara
Home Financials for this Owner
Home Financials are based on the most recent Mortgage that was taken out on this home.
Original Mortgage
$210,000
Interest Rate
8.19%
Purchase Details
Closed on
Apr 17, 1996
Sold by
Bishop Beth Ann
Bought by
Bishop Michael R
Home Financials for this Owner
Home Financials are based on the most recent Mortgage that was taken out on this home.
Original Mortgage
$26,000
Interest Rate
7.84%
Purchase Details
Closed on
Dec 30, 1993
Sold by
Bishop Beth A
Bought by
Bishop Michael R
Home Financials for this Owner
Home Financials are based on the most recent Mortgage that was taken out on this home.
Original Mortgage
$83,000
Interest Rate
7.38%
Create a Home Valuation Report for This Property
The Home Valuation Report is an in-depth analysis detailing your home's value as well as a comparison with similar homes in the area
Home Values in the Area
Average Home Value in this Area
Purchase History
| Date | Buyer | Sale Price | Title Company |
|---|---|---|---|
| Macias Sara | -- | None Listed On Document | |
| Macias Sara | -- | None Listed On Document | |
| Alatorre Ramon | $262,500 | North American Title Co | |
| Bishop Michael R | -- | Stewart Title Co | |
| Bishop Michael R | -- | Investors Title Company |
Source: Public Records
Mortgage History
| Date | Status | Borrower | Loan Amount |
|---|---|---|---|
| Previous Owner | Alatorre Ramon | $210,000 | |
| Previous Owner | Bishop Michael R | $26,000 | |
| Previous Owner | Bishop Michael R | $83,000 |
Source: Public Records
Tax History
| Year | Tax Paid | Tax Assessment Tax Assessment Total Assessment is a certain percentage of the fair market value that is determined by local assessors to be the total taxable value of land and additions on the property. | Land | Improvement |
|---|---|---|---|---|
| 2025 | $5,018 | $847,767 | $773,318 | $74,449 |
| 2024 | $5,018 | $387,781 | $312,679 | $75,102 |
| 2023 | $4,830 | $380,178 | $306,548 | $73,630 |
| 2022 | $4,638 | $372,724 | $300,537 | $72,187 |
| 2021 | $4,483 | $365,416 | $294,644 | $70,772 |
| 2020 | $4,426 | $361,670 | $291,623 | $70,047 |
| 2019 | $4,330 | $354,579 | $285,905 | $68,674 |
| 2018 | $4,242 | $347,627 | $280,299 | $67,328 |
| 2017 | $4,173 | $340,811 | $274,803 | $66,008 |
| 2016 | $4,086 | $334,129 | $269,415 | $64,714 |
| 2015 | $4,045 | $329,111 | $265,369 | $63,742 |
| 2014 | $3,955 | $322,665 | $260,171 | $62,494 |
Source: Public Records
Map
Nearby Homes
- 3040 Killybrooke Ln
- 3102 Warren Ln
- 3157 Cork Ln
- 3084 Taylor Way
- 1616 Iowa St Unit C
- 1616 Sandalwood St
- 1068 Concord St
- 3012 Garfield Ave
- 1096 Tulare Dr
- 3032 Grant Ave
- 2912 Andros St
- 3141 Barbados Place
- 3263 Turlock Dr
- 3268 Michigan Ave
- 1016 Valencia St
- 1030 Palmetto Way
- 3051 Madeira Ave
- 403 Aura Dr
- 1547 Amberleaf
- 952 Cheyenne St
- 3061 Royce Ln
- 3074 Killybrooke Ln
- 3070 Killybrooke Ln
- 3057 Royce Ln
- 1340 Watson Ave
- 3064 Killybrooke Ln
- 1336 Watson Ave
- 3064 Royce Ln
- 1344 Watson Ave
- 3060 Royce Ln
- 1332 Watson Ave
- 3051 Royce Ln
- 3060 Killybrooke Ln
- 3088 Killybrooke Ln
- 3056 Royce Ln
- 1326 Watson Ave
- 3056 Killybrooke Ln
- 3047 Royce Ln
- 3050 Royce Ln
- 1333 Conway Ave
Your Personal Tour Guide
Ask me questions while you tour the home.