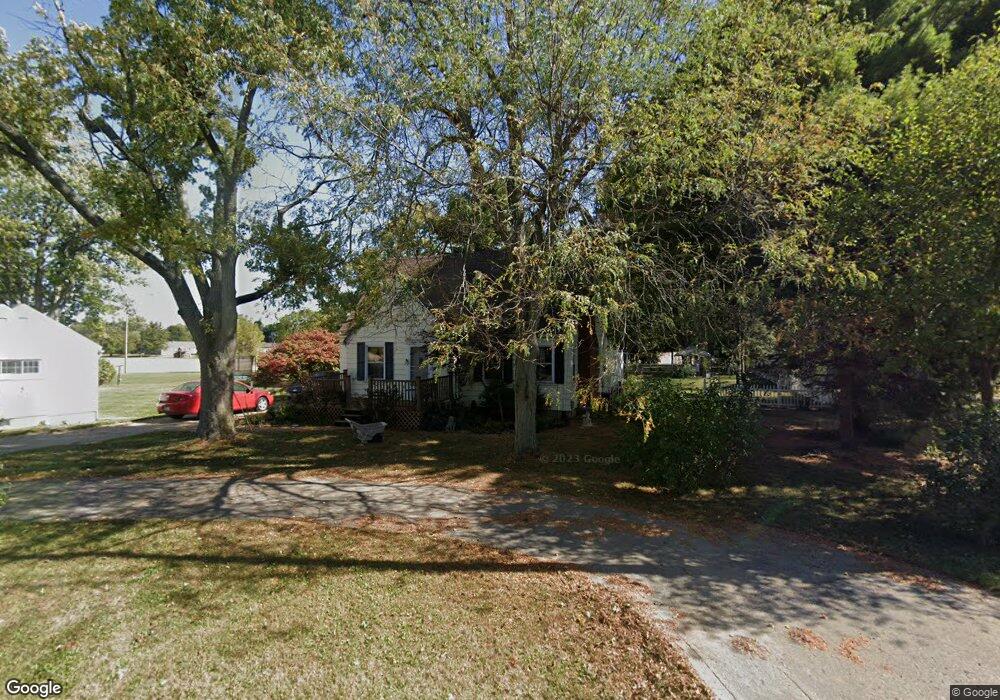
3070 Selma Rd Springfield, OH 45505
Estimated Value: $205,000 - $235,369
4
Beds
2
Baths
1,700
Sq Ft
$128/Sq Ft
Est. Value
About This Home
This home is located at 3070 Selma Rd, Springfield, OH 45505 and is currently estimated at $217,342, approximately $127 per square foot. 3070 Selma Rd is a home located in Clark County with nearby schools including Possum Elementary School, Shawnee Middle School/High School, and Springfield Preparatory & Fitness Academy.
Ownership History
Date
Name
Owned For
Owner Type
Purchase Details
Closed on
Dec 9, 2024
Sold by
Kohut Sharon F and Kohut James B
Bought by
Mitchem Jace
Current Estimated Value
Home Financials for this Owner
Home Financials are based on the most recent Mortgage that was taken out on this home.
Original Mortgage
$179,450
Outstanding Balance
$177,527
Interest Rate
6.72%
Mortgage Type
New Conventional
Estimated Equity
$39,815
Purchase Details
Closed on
Sep 14, 2017
Sold by
Kohut Sharon K and Robertson Lesta R
Bought by
Kohut Sharon F and Kohut James B
Purchase Details
Closed on
Mar 19, 2010
Sold by
Kohut Sharon F
Bought by
Kohut Sharon F and Robertson Lesta P
Home Financials for this Owner
Home Financials are based on the most recent Mortgage that was taken out on this home.
Original Mortgage
$129,731
Interest Rate
4.97%
Mortgage Type
FHA
Purchase Details
Closed on
Dec 2, 1991
Create a Home Valuation Report for This Property
The Home Valuation Report is an in-depth analysis detailing your home's value as well as a comparison with similar homes in the area
Home Values in the Area
Average Home Value in this Area
Purchase History
| Date | Buyer | Sale Price | Title Company |
|---|---|---|---|
| Mitchem Jace | $185,000 | None Listed On Document | |
| Kohut Sharon F | -- | None Available | |
| Kohut Sharon F | -- | None Available | |
| -- | $73,000 | -- |
Source: Public Records
Mortgage History
| Date | Status | Borrower | Loan Amount |
|---|---|---|---|
| Open | Mitchem Jace | $179,450 | |
| Previous Owner | Kohut Sharon F | $129,731 |
Source: Public Records
Tax History
| Year | Tax Paid | Tax Assessment Tax Assessment Total Assessment is a certain percentage of the fair market value that is determined by local assessors to be the total taxable value of land and additions on the property. | Land | Improvement |
|---|---|---|---|---|
| 2025 | $2,484 | $61,870 | $14,130 | $47,740 |
| 2024 | $2,420 | $49,540 | $10,230 | $39,310 |
| 2023 | $2,420 | $49,540 | $10,230 | $39,310 |
| 2022 | $2,400 | $49,540 | $10,230 | $39,310 |
| 2021 | $2,085 | $38,540 | $7,930 | $30,610 |
| 2020 | $2,103 | $38,540 | $7,930 | $30,610 |
| 2019 | $2,136 | $38,540 | $7,930 | $30,610 |
| 2018 | $1,849 | $32,910 | $7,210 | $25,700 |
| 2017 | $1,895 | $32,911 | $7,207 | $25,704 |
| 2016 | $1,709 | $32,911 | $7,207 | $25,704 |
| 2015 | $1,717 | $31,949 | $7,207 | $24,742 |
| 2014 | $1,721 | $31,949 | $7,207 | $24,742 |
| 2013 | $1,496 | $31,949 | $7,207 | $24,742 |
Source: Public Records
Map
Nearby Homes
- 2390 Old Selma Rd
- 2215 Hackberry St
- 2214 Hackberry St
- 2211 Hackberry St
- 2210 Hackberry St
- 2207 Hackberry St
- 2209 Hackberry St
- 2208 Hackberry St
- 2224 Cheviot Hills Dr
- 2037 Gerald Dr
- 2076-2078 Stowe Dr
- 711 Kinnane Ave
- 533 Highview Ave
- 1835 S Sweetbriar Ln
- 533 Lyle Ave
- 2040 N Hadley Rd
- 1630 S Sweetbriar Ln
- 1633 N Sweetbriar Ln
- 1806 N Sweetbriar Ln
- 2108 Sunset Ave
Your Personal Tour Guide
Ask me questions while you tour the home.