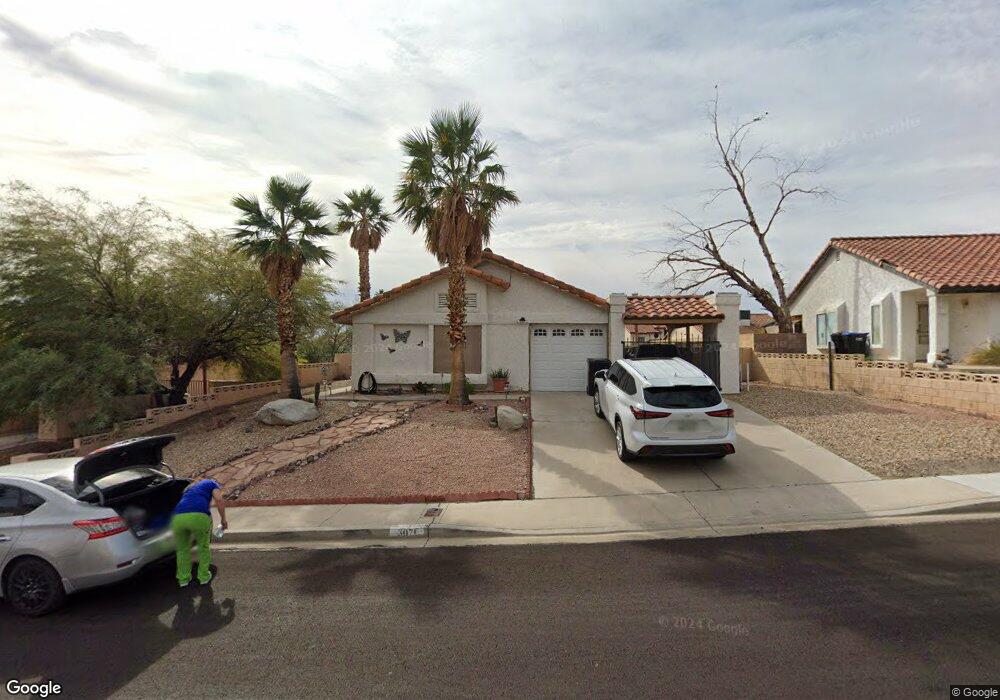
3071 Quantana Way Laughlin, NV 89029
Estimated Value: $238,000 - $286,000
3
Beds
2
Baths
1,144
Sq Ft
$233/Sq Ft
Est. Value
About This Home
This home is located at 3071 Quantana Way, Laughlin, NV 89029 and is currently estimated at $266,698, approximately $233 per square foot. 3071 Quantana Way is a home located in Clark County with nearby schools including William G. Bennett Elementary School and Laughlin Junior/Senior High School.
Ownership History
Date
Name
Owned For
Owner Type
Purchase Details
Closed on
Jan 1, 2017
Sold by
Bodin Bruce R
Bought by
Bodin Bruce R and Brb Living Trust
Current Estimated Value
Purchase Details
Closed on
Oct 1, 2010
Sold by
Kim Churg Min and Kim Carolyn
Bought by
Federal National Mortgage Association
Purchase Details
Closed on
Oct 18, 2006
Sold by
Kim Chung Min and Kim Carolyn
Bought by
Prominent Investment Group Inc
Home Financials for this Owner
Home Financials are based on the most recent Mortgage that was taken out on this home.
Original Mortgage
$148,000
Interest Rate
6.53%
Mortgage Type
Unknown
Purchase Details
Closed on
Aug 24, 2006
Sold by
Ramsey Robert A
Bought by
Kim Chung Min and Kim Carolyn
Home Financials for this Owner
Home Financials are based on the most recent Mortgage that was taken out on this home.
Original Mortgage
$148,000
Interest Rate
6.53%
Mortgage Type
Unknown
Purchase Details
Closed on
Oct 18, 2002
Sold by
Ramsey Robert A and Ramsey Lisa L
Bought by
Ramsey Robert A
Create a Home Valuation Report for This Property
The Home Valuation Report is an in-depth analysis detailing your home's value as well as a comparison with similar homes in the area
Purchase History
| Date | Buyer | Sale Price | Title Company |
|---|---|---|---|
| Bodin Bruce R | -- | None Available | |
| Federal National Mortgage Association | $152,991 | Accommodation | |
| Prominent Investment Group Inc | -- | None Available | |
| Kim Chung Min | $185,000 | Southwest Title | |
| Ramsey Robert A | -- | -- |
Source: Public Records
Mortgage History
| Date | Status | Borrower | Loan Amount |
|---|---|---|---|
| Previous Owner | Kim Chung Min | $148,000 |
Source: Public Records
Tax History
| Year | Tax Paid | Tax Assessment Tax Assessment Total Assessment is a certain percentage of the fair market value that is determined by local assessors to be the total taxable value of land and additions on the property. | Land | Improvement |
|---|---|---|---|---|
| 2026 | $1,429 | $43,159 | $14,700 | $28,459 |
| 2025 | $1,419 | $42,653 | $13,300 | $29,353 |
| 2024 | $1,314 | $42,653 | $13,300 | $29,353 |
| 2023 | $1,314 | $48,311 | $19,600 | $28,711 |
| 2022 | $1,217 | $42,254 | $15,750 | $26,504 |
| 2021 | $1,127 | $39,200 | $13,650 | $25,550 |
| 2020 | $1,044 | $39,278 | $13,650 | $25,628 |
| 2019 | $979 | $37,114 | $11,550 | $25,564 |
| 2018 | $934 | $36,043 | $11,200 | $24,843 |
| 2017 | $1,213 | $36,219 | $10,850 | $25,369 |
| 2016 | $874 | $32,943 | $7,000 | $25,943 |
| 2015 | $873 | $29,557 | $5,250 | $24,307 |
| 2014 | $846 | $24,542 | $5,250 | $19,292 |
Source: Public Records
Map
Nearby Homes
- 3048 Soledad Dr
- 3095 Quantana Way
- 3064 Antigua Dr
- 1596 Paloma Ave
- 3176 Arroya Ct
- 1615 Granada St
- 1671 Granada St
- 1655 Granada St
- 1826 Dunes Ct
- 3253 Calanda St
- 3250 Mirador St
- 3262 Del Monte St
- 3280 Del Monte St
- 1608 Cajon Ct
- 1609 Cajon Ct
- 1641 Esquina St
- 1611 Esquina St
- 2016 Mesquite Ln Unit 302
- 2016 Mesquite Ln Unit 104
- 2028 Mesquite Ln Unit 202
- 3083 Quantana Way
- 3059 Quantana Way
- 3078 Palo Verde Dr
- 3088 Palo Verde Dr
- 3068 Palo Verde Dr
- 3047 Quantana Way
- 3048 Quantana Way
- 3098 Palo Verde Dr
- 3061 Leandro Ct
- 3107 Quantana Way
- 3061 S Leandro Ct
- 3035 Quantana Way
- 3108 Palo Verde Dr
- 3058 Soledad Dr
- 3036 Quantana Way
- 3049 Leandro Ct
- 3098 Leandro Ct
- 3098 S Leandro Ct
- 3038 Soledad Dr
- 3119 Quantana Way
Your Personal Tour Guide
Ask me questions while you tour the home.