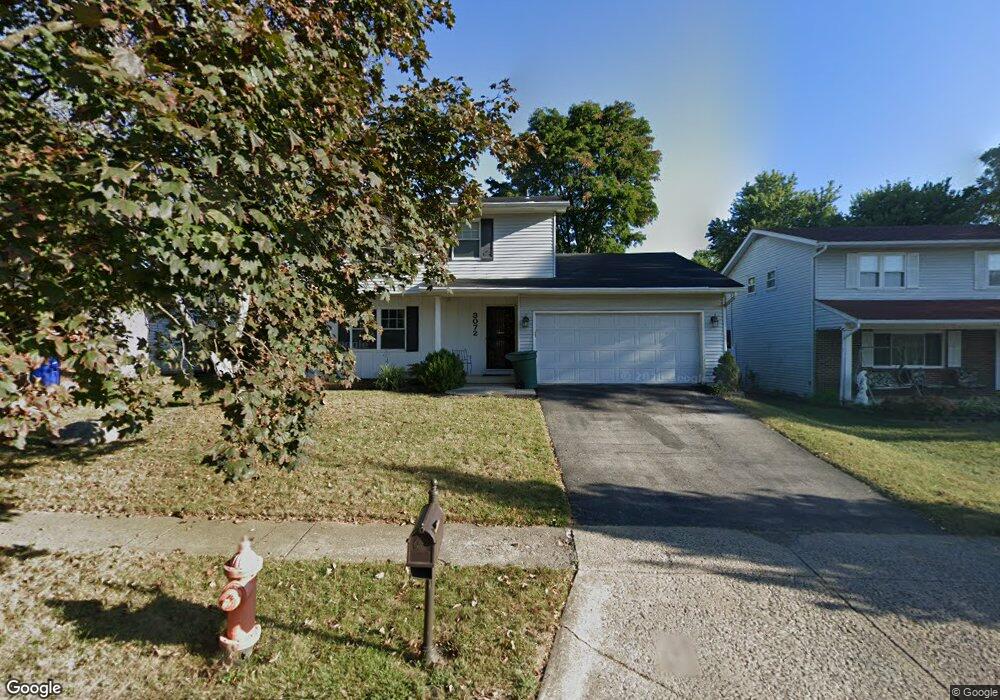
3072 Adirondack Ave Columbus, OH 43231
Northern Woods NeighborhoodEstimated Value: $313,000 - $374,000
4
Beds
3
Baths
1,960
Sq Ft
$172/Sq Ft
Est. Value
About This Home
This home is located at 3072 Adirondack Ave, Columbus, OH 43231 and is currently estimated at $336,170, approximately $171 per square foot. 3072 Adirondack Ave is a home located in Franklin County with nearby schools including Avalon Elementary School, Northgate Intermediate, and Woodward Park Middle School.
Ownership History
Date
Name
Owned For
Owner Type
Purchase Details
Closed on
Feb 7, 2005
Sold by
Thurmond Jennifer M and Finn Keith E
Bought by
Gilbert David
Current Estimated Value
Home Financials for this Owner
Home Financials are based on the most recent Mortgage that was taken out on this home.
Original Mortgage
$115,120
Outstanding Balance
$57,395
Interest Rate
5.87%
Mortgage Type
New Conventional
Estimated Equity
$278,775
Purchase Details
Closed on
Nov 4, 2002
Sold by
Thurmond Jennifer M
Bought by
Thurmond Jennifer M and Finn Keith E
Home Financials for this Owner
Home Financials are based on the most recent Mortgage that was taken out on this home.
Original Mortgage
$97,000
Interest Rate
6.13%
Purchase Details
Closed on
Jul 3, 1995
Sold by
Asher Forest T
Bought by
Jennifer M Thurmond
Home Financials for this Owner
Home Financials are based on the most recent Mortgage that was taken out on this home.
Original Mortgage
$98,800
Interest Rate
7.5%
Mortgage Type
New Conventional
Create a Home Valuation Report for This Property
The Home Valuation Report is an in-depth analysis detailing your home's value as well as a comparison with similar homes in the area
Home Values in the Area
Average Home Value in this Area
Purchase History
| Date | Buyer | Sale Price | Title Company |
|---|---|---|---|
| Gilbert David | $143,900 | 21St Centu | |
| Thurmond Jennifer M | $527,000 | Warranty Title | |
| Jennifer M Thurmond | $104,000 | -- |
Source: Public Records
Mortgage History
| Date | Status | Borrower | Loan Amount |
|---|---|---|---|
| Open | Gilbert David | $115,120 | |
| Previous Owner | Thurmond Jennifer M | $97,000 | |
| Previous Owner | Jennifer M Thurmond | $98,800 | |
| Closed | Gilbert David | $28,780 |
Source: Public Records
Tax History
| Year | Tax Paid | Tax Assessment Tax Assessment Total Assessment is a certain percentage of the fair market value that is determined by local assessors to be the total taxable value of land and additions on the property. | Land | Improvement |
|---|---|---|---|---|
| 2025 | $4,788 | $106,680 | $21,000 | $85,680 |
| 2024 | $4,788 | $106,680 | $21,000 | $85,680 |
| 2023 | $4,727 | $106,680 | $21,000 | $85,680 |
| 2022 | $3,733 | $71,970 | $14,390 | $57,580 |
| 2021 | $3,739 | $71,970 | $14,390 | $57,580 |
| 2020 | $3,744 | $71,970 | $14,390 | $57,580 |
| 2019 | $3,470 | $57,200 | $11,520 | $45,680 |
| 2018 | $3,100 | $57,200 | $11,520 | $45,680 |
| 2017 | $3,241 | $57,200 | $11,520 | $45,680 |
| 2016 | $3,015 | $45,510 | $10,680 | $34,830 |
| 2015 | $2,737 | $45,510 | $10,680 | $34,830 |
| 2014 | $2,743 | $45,510 | $10,680 | $34,830 |
| 2013 | $1,424 | $47,880 | $11,235 | $36,645 |
Source: Public Records
Map
Nearby Homes
- 5639 Holyoke Ln
- 5562 Cartwright Ln Unit 13
- 3194 Adirondack Ave
- 5685 Great Woods Blvd Unit 5685
- 5381 Valley Ln E Unit Z57
- 3288 Valley Ln S Unit Z8
- 5700 Crossing Ct Unit 4
- 5730 Crossing Ct Unit 1
- 3050 Cooper Bluff Dr
- 2899 Granada Hills Dr
- 3001 Cooper Bluff Dr Unit 3001
- 3113 Highcliff Ct Unit 3113
- 3048 Highcliff Ct
- 3227 Minerva Lake Rd
- 5534 Westerville Crossing Dr
- 3137 Heron Pointe Unit 202
- 3073 Birch Hollow Way Unit 3073
- 2688 Woodley Rd
- 3509 Canberra Ct
- 6200 Harbour Pointe Unit 301
- 3080 Adirondack Ave
- 3066 Adirondack Ave
- 3069 Rainier Ave
- 3075 Rainier Ave
- 3088 Adirondack Ave
- 3059 Rainier Ave
- 3085 Rainier Ave
- 3058 Adirondack Ave
- 3071 Adirondack Ave
- 3081 Adirondack Ave
- 3098 Adirondack Ave
- 3051 Rainier Ave
- 3061 Adirondack Ave
- 3095 Rainier Ave
- 3089 Adirondack Ave
- 3048 Adirondack Ave
- 3043 Rainier Ave
- 5560 Ponderosa Dr
- 3106 Adirondack Ave
- 3103 Rainier Ave
Your Personal Tour Guide
Ask me questions while you tour the home.