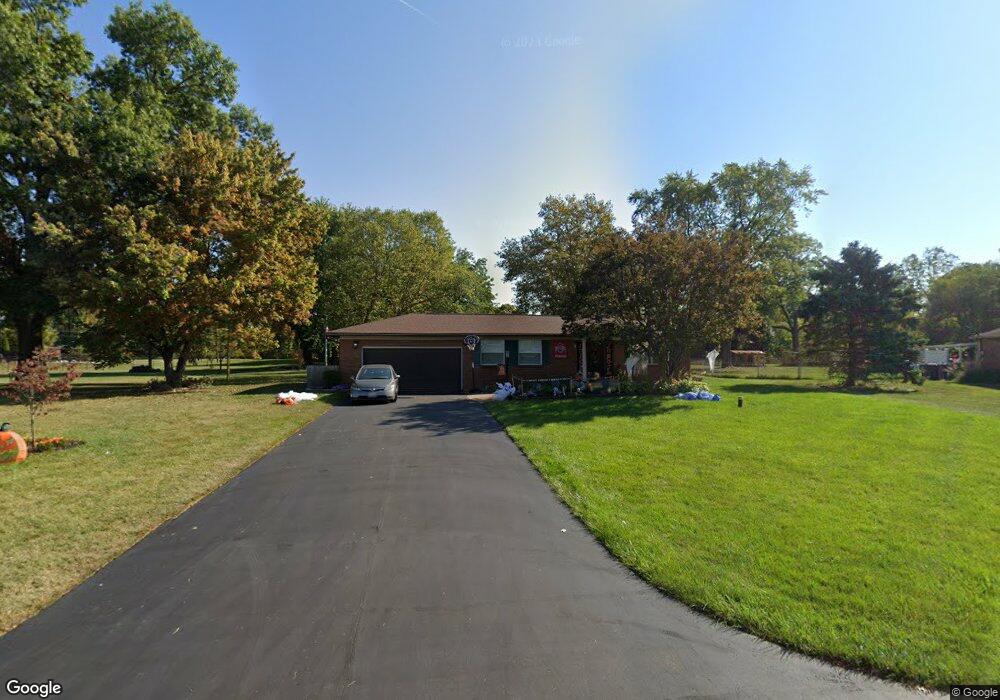
3074 Eastwick Rd Columbus, OH 43232
Glenbrook NeighborhoodEstimated Value: $276,000 - $308,000
3
Beds
2
Baths
1,512
Sq Ft
$194/Sq Ft
Est. Value
About This Home
This home is located at 3074 Eastwick Rd, Columbus, OH 43232 and is currently estimated at $293,529, approximately $194 per square foot. 3074 Eastwick Rd is a home located in Franklin County with nearby schools including Groveport Madison High School, Millennium Community School, and South Scioto Academy.
Ownership History
Date
Name
Owned For
Owner Type
Purchase Details
Closed on
May 5, 2020
Sold by
Freeland Selena G and Freeland Selena
Bought by
Howard Christina M and Howard Anthony R
Current Estimated Value
Home Financials for this Owner
Home Financials are based on the most recent Mortgage that was taken out on this home.
Original Mortgage
$181,300
Outstanding Balance
$160,657
Interest Rate
3.3%
Mortgage Type
VA
Estimated Equity
$132,872
Purchase Details
Closed on
Nov 13, 2018
Sold by
Freeland Selena and The Paul H Vlack Family Trust
Bought by
Freeland Selena
Home Financials for this Owner
Home Financials are based on the most recent Mortgage that was taken out on this home.
Original Mortgage
$125,000
Interest Rate
4.9%
Mortgage Type
Purchase Money Mortgage
Purchase Details
Closed on
May 18, 1999
Sold by
Vlack Paul and Vlack Connie
Bought by
Vlack Connie E
Purchase Details
Closed on
Aug 6, 1965
Bought by
Vlack Paul and Vlack Connie
Create a Home Valuation Report for This Property
The Home Valuation Report is an in-depth analysis detailing your home's value as well as a comparison with similar homes in the area
Home Values in the Area
Average Home Value in this Area
Purchase History
| Date | Buyer | Sale Price | Title Company |
|---|---|---|---|
| Howard Christina M | $175,000 | Valmer Land Title Agency | |
| Freeland Selena | -- | None Available | |
| Vlack Connie E | -- | -- | |
| Vlack Paul | -- | -- |
Source: Public Records
Mortgage History
| Date | Status | Borrower | Loan Amount |
|---|---|---|---|
| Open | Howard Christina M | $181,300 | |
| Closed | Freeland Selena | $125,000 |
Source: Public Records
Tax History Compared to Growth
Tax History
| Year | Tax Paid | Tax Assessment Tax Assessment Total Assessment is a certain percentage of the fair market value that is determined by local assessors to be the total taxable value of land and additions on the property. | Land | Improvement |
|---|---|---|---|---|
| 2024 | $4,417 | $91,630 | $27,720 | $63,910 |
| 2023 | $4,378 | $91,630 | $27,720 | $63,910 |
| 2022 | $3,498 | $58,240 | $17,500 | $40,740 |
| 2021 | $3,511 | $58,240 | $17,500 | $40,740 |
| 2020 | $3,464 | $57,330 | $17,500 | $39,830 |
| 2019 | $3,224 | $46,970 | $14,000 | $32,970 |
| 2018 | $1,319 | $46,970 | $14,000 | $32,970 |
| 2017 | $2,644 | $46,970 | $14,000 | $32,970 |
| 2016 | $2,304 | $38,960 | $8,820 | $30,140 |
| 2015 | $1,162 | $38,960 | $8,820 | $30,140 |
| 2014 | $2,187 | $38,960 | $8,820 | $30,140 |
| 2013 | $931 | $38,955 | $8,820 | $30,135 |
Source: Public Records
Map
Nearby Homes
- 3059 Remington Ridge Rd
- 3100 Westaire Ct
- 3105 Wessex Ct
- 2825 S Hampton Rd
- 0 Wessex Ct
- 3811 Bay Village St
- St Martin Plan at Willow Reserve Townhomes
- St Martin Plan at Spangler Farms
- 2747 Mchenry Dr
- 2743 Mchenry Dr
- 2735 Mchenry Dr
- 3365 Bruceton Ave
- 2723 Mchenry Dr
- 2715 Mchenry Dr
- 2711 Mchenry Dr
- 2652 Tealwater Trail Dr
- 3830 Charbonnett Ct Unit 6-A
- 3242 Mackinac Dr
- 2690 Meigs Dr
- 2697 Meigs Dr
- 3090 Eastwick Rd
- 3050 Eastwick Rd
- 3104 Eastwick Rd
- 3063 Eastwick Rd
- 3115 Winchester Pike
- 3038 Eastwick Rd
- 3081 Eastwick Rd
- 3105 Eastwick Rd
- 3118 Eastwick Rd
- 3099 Winchester Pike
- 3026 Eastwick Rd
- 3093 Winchester Pike
- 3121 Eastwick Rd
- 3060 Marwick Rd
- 3130 Eastwick Rd
- 3068 Marwick Rd
- 3082 Marwick Rd
- 3085 Winchester Pike
- 3163 Winchester Pike
- 3030 Eastwick Rd