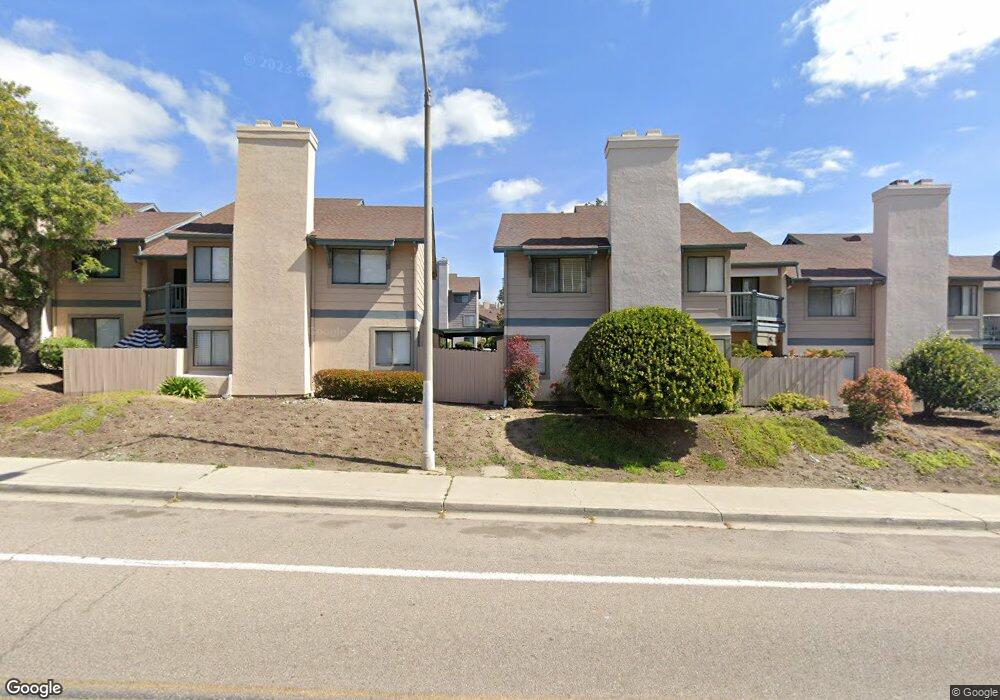
3075 Brookpine Ct Spring Valley, CA 91978
Estimated Value: $400,865 - $426,000
1
Bed
1
Bath
700
Sq Ft
$582/Sq Ft
Est. Value
About This Home
This home is located at 3075 Brookpine Ct, Spring Valley, CA 91978 and is currently estimated at $407,216, approximately $581 per square foot. 3075 Brookpine Ct is a home located in San Diego County with nearby schools including Avocado Elementary School, Hillsdale Middle School, and Monte Vista High School.
Ownership History
Date
Name
Owned For
Owner Type
Purchase Details
Closed on
Jul 30, 1998
Sold by
Bank Of Commerce
Bought by
Manosalva Anthony
Current Estimated Value
Home Financials for this Owner
Home Financials are based on the most recent Mortgage that was taken out on this home.
Original Mortgage
$50,500
Interest Rate
6.88%
Mortgage Type
Purchase Money Mortgage
Purchase Details
Closed on
Apr 6, 1998
Sold by
Hud
Bought by
Bank Of Commerce
Purchase Details
Closed on
Oct 30, 1997
Sold by
Nationsbanc Mtg Corp
Bought by
Hud
Purchase Details
Closed on
Oct 14, 1997
Sold by
Brown Laura M
Bought by
Nationsbanc Mtg Corp
Purchase Details
Closed on
Jan 15, 1992
Purchase Details
Closed on
Aug 1, 1984
Create a Home Valuation Report for This Property
The Home Valuation Report is an in-depth analysis detailing your home's value as well as a comparison with similar homes in the area
Home Values in the Area
Average Home Value in this Area
Purchase History
| Date | Buyer | Sale Price | Title Company |
|---|---|---|---|
| Manosalva Anthony | $50,500 | Chicago Title Co | |
| Bank Of Commerce | $39,000 | Chicago Title | |
| Hud | -- | Old Republic Title Company | |
| Nationsbanc Mtg Corp | $75,996 | Benefit Land Title Company | |
| -- | $74,500 | -- | |
| -- | $59,500 | -- |
Source: Public Records
Mortgage History
| Date | Status | Borrower | Loan Amount |
|---|---|---|---|
| Previous Owner | Manosalva Anthony | $50,500 |
Source: Public Records
Tax History
| Year | Tax Paid | Tax Assessment Tax Assessment Total Assessment is a certain percentage of the fair market value that is determined by local assessors to be the total taxable value of land and additions on the property. | Land | Improvement |
|---|---|---|---|---|
| 2025 | $1,554 | $79,138 | $30,436 | $48,702 |
| 2024 | $1,554 | $77,588 | $29,840 | $47,748 |
| 2023 | $1,498 | $76,067 | $29,255 | $46,812 |
| 2022 | $1,453 | $74,577 | $28,682 | $45,895 |
| 2021 | $1,446 | $73,116 | $28,120 | $44,996 |
| 2020 | $1,397 | $72,367 | $27,832 | $44,535 |
| 2019 | $1,376 | $70,949 | $27,287 | $43,662 |
| 2018 | $1,226 | $69,558 | $26,752 | $42,806 |
| 2017 | $1,170 | $68,195 | $26,228 | $41,967 |
| 2016 | $1,104 | $66,859 | $25,714 | $41,145 |
| 2015 | $1,093 | $65,855 | $25,328 | $40,527 |
| 2014 | $1,078 | $64,566 | $24,832 | $39,734 |
Source: Public Records
Map
Nearby Homes
- 3065 Charwood Ct
- 3067 Charwood Ct
- 3037 Chipwood Ct
- 2910 Elm Tree Ct
- 2930 Anawood Way
- 3003 Blue Oak Ct
- 2946 Alanwood Ct
- 2962 Alanwood Ct
- 10770 Jamacha Blvd Unit 104
- 10770 Jamacha Blvd Unit 74
- 10865 Charing Cross Rd
- 3331 Eton Greens Ct
- 10767 Jamacha Blvd Unit SPC 119
- 10767 Jamacha Blvd Unit SPC 62
- 10767 Jamacha Blvd Unit 168
- 10767 Jamacha Blvd Unit SPC 151
- 10767 Jamacha Blvd Unit 130
- 10767 Jamacha Blvd Unit 217
- 10767 Jamacha Blvd Unit 242
- 10707 Jamacha Blvd Unit 24
- 3033 Brookpine Ct Unit 15
- 3047 Brookpine Ct
- 3051 Brookpine Ct
- 3057 Brookpine Ct
- 3005 Brookpine Ct Unit 26
- 3007 Brookpine Ct
- 3017 Brookpine Ct
- 3023 Brookpine Ct Unit 18
- 3029 Brookpine Ct Unit 16
- 3041 Brookpine Ct
- 3045 Brookpine Ct
- 3053 Brookpine Ct Unit 8
- 3063 Brookpine Ct Unit 5
- 3065 Brookpine Ct
- 3069 Brookpine Ct
- 3073 Brookpine Ct
- 3003 Brookpine Ct
- 3011 Brookpine Ct
- 3013 Brookpine Ct
- 3021 Brookpine Ct
Your Personal Tour Guide
Ask me questions while you tour the home.