Estimated Value: $172,000 - $250,000
Studio
1
Bath
1,080
Sq Ft
$200/Sq Ft
Est. Value
About This Home
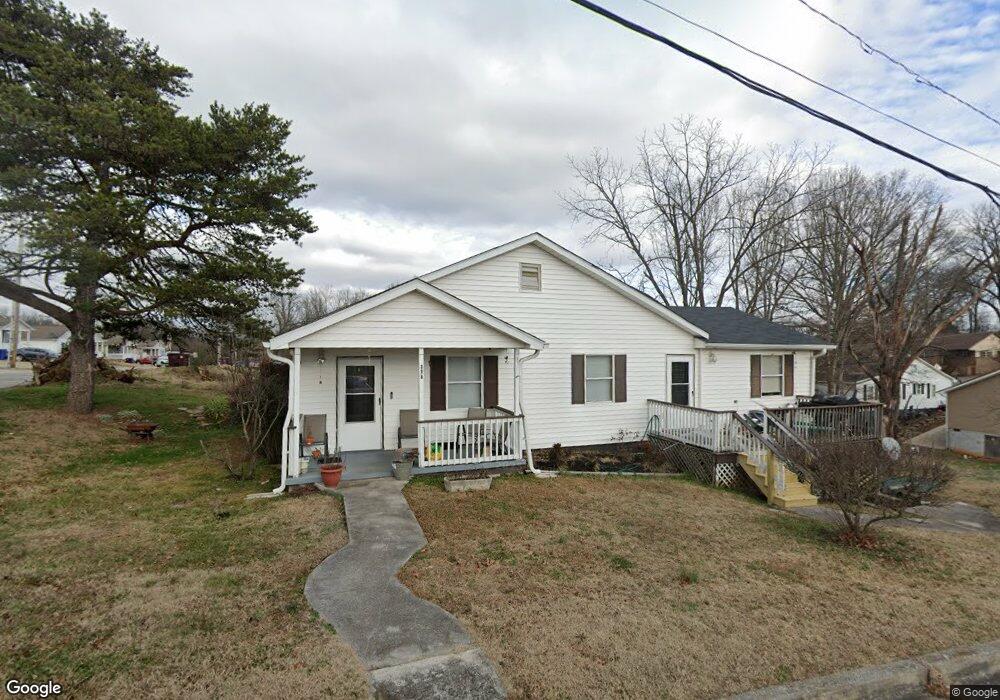
This home is located at 308 E Bell St, Alcoa, TN 37701 and is currently estimated at $215,820, approximately $199 per square foot. 308 E Bell St is a home located in Blount County with nearby schools including Alcoa Elementary School, Alcoa Middle School, and Alcoa High School.
Ownership History
Date
Name
Owned For
Owner Type
Purchase Details
Closed on
Dec 4, 2018
Sold by
Beloved Community Outreach
Bought by
Valentine Brandon
Current Estimated Value
Purchase Details
Closed on
Aug 24, 2016
Sold by
Gilmore Tyris Mary
Bought by
The Beloved Community Outreach
Purchase Details
Closed on
Mar 30, 2006
Bought by
Gilmore Tyris and Gilmore Mary
Home Financials for this Owner
Home Financials are based on the most recent Mortgage that was taken out on this home.
Original Mortgage
$52,800
Interest Rate
11.21%
Purchase Details
Closed on
Oct 16, 2003
Bought by
Gilmore Tyris Lee
Home Financials for this Owner
Home Financials are based on the most recent Mortgage that was taken out on this home.
Original Mortgage
$35,000
Interest Rate
6.03%
Purchase Details
Closed on
May 2, 2003
Sold by
Gilmore Tyris and Gilmore Mary A
Bought by
Federal National Mortgage Association
Purchase Details
Closed on
Aug 16, 1985
Bought by
Dickey William H and Dickey Carri
Create a Home Valuation Report for This Property
The Home Valuation Report is an in-depth analysis detailing your home's value as well as a comparison with similar homes in the area
Home Values in the Area
Average Home Value in this Area
Purchase History
| Date | Buyer | Sale Price | Title Company |
|---|---|---|---|
| Valentine Brandon | $1,000 | -- | |
| The Beloved Community Outreach | -- | -- | |
| Gilmore Tyris | $62,500 | -- | |
| Gilmore Tyris Lee | $35,000 | -- | |
| Federal National Mortgage Association | $60,916 | -- | |
| Dickey William H | -- | -- |
Source: Public Records
Mortgage History
| Date | Status | Borrower | Loan Amount |
|---|---|---|---|
| Previous Owner | Dickey William H | $52,800 | |
| Previous Owner | Dickey William H | $35,000 |
Source: Public Records
Tax History
| Year | Tax Paid | Tax Assessment Tax Assessment Total Assessment is a certain percentage of the fair market value that is determined by local assessors to be the total taxable value of land and additions on the property. | Land | Improvement |
|---|---|---|---|---|
| 2025 | -- | $35,700 | $7,500 | $28,200 |
| 2024 | -- | $35,700 | $7,500 | $28,200 |
| 2023 | $1,171 | $35,700 | $7,500 | $28,200 |
| 2022 | $842 | $17,775 | $3,000 | $14,775 |
| 2021 | $842 | $17,775 | $3,000 | $14,775 |
| 2020 | $842 | $17,775 | $3,000 | $14,775 |
| 2019 | $842 | $17,775 | $3,000 | $14,775 |
| 2018 | $689 | $15,550 | $2,025 | $13,525 |
| 2017 | $689 | $15,550 | $2,025 | $13,525 |
| 2016 | $689 | $15,550 | $2,025 | $13,525 |
| 2015 | $639 | $15,550 | $2,025 | $13,525 |
| 2014 | $715 | $15,550 | $2,025 | $13,525 |
| 2013 | $715 | $17,375 | $0 | $0 |
Source: Public Records
Map
Nearby Homes
- 181 E Edison St
- 124 E Franklin St
- 232 W Stephenson St
- 0 N Wright Rd
- 1240 N Wright Rd
- 360 N Wright Rd
- 1372 Remsen St
- 1362 Dalton St
- 1443 Aberdeen Dr
- 922 Poplar St
- 966 Poplar St
- 1826 Peppertree Dr
- 978 N Linden Dr
- 104 Roosevelt St
- 602 Mcginley St
- 604 Middle St
- 1310 Madison Ave
- 404 N 5th St
- 507 Rule St
- 1418 Mountain Quail Cir
Your Personal Tour Guide
Ask me questions while you tour the home.