
Seller's Agent in 2025
Tony Young
Young Home Sales
(501) 352-1032
5 in this area
170 Total Sales
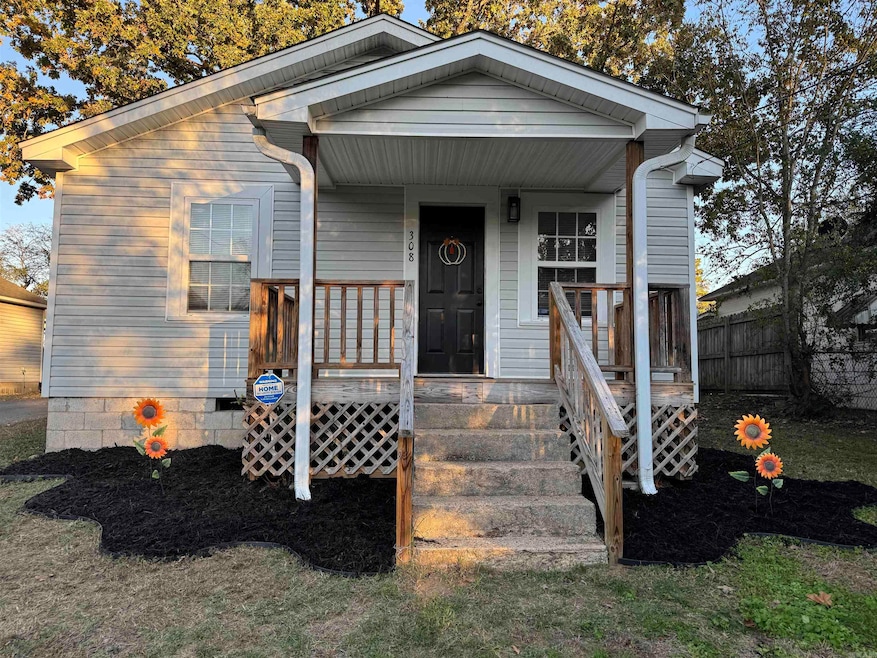


You are going to LOVE this fully remodeled 2 bedroom 2 full bath home! Every inch of this home has been beautifully updated. Enjoy the inviting living area highlighted by a shiplap accent wall and contemporary electric fireplace, The kitchen shines with butcher block countertops, designer light fixtures, and a built in coffee bar area. Both bathrooms are completely remodeled with a clean, modern look. Outside you'll find charming curb appeal and a welcoming front porch with newer windows and doors, This home is move in ready , meticulously updated, and waiting for its new owner- schedule your showing today! see agent remarks
| Date | Type | Sale Price | Title Company |
|---|---|---|---|
| Warranty Deed | $138,500 | Arkansas Title | |
| Warranty Deed | $70,000 | American Abstract & Title | |
| Warranty Deed | $70,000 | American Abstract & Title | |
| Warranty Deed | $18,000 | -- | |
| Warranty Deed | $20,000 | -- |
| Date | Status | Loan Amount | Loan Type |
|---|---|---|---|
| Open | $106,500 | New Conventional | |
| Previous Owner | $85,000 | Construction |
| Date | Event | Price | List to Sale | Price per Sq Ft |
|---|---|---|---|---|
| 12/05/2025 12/05/25 | Sold | $138,500 | -1.1% | $163 / Sq Ft |
| 12/05/2025 12/05/25 | Pending | -- | -- | -- |
| 11/06/2025 11/06/25 | For Sale | $140,000 | -- | $164 / Sq Ft |
| Year | Tax Paid | Tax Assessment Tax Assessment Total Assessment is a certain percentage of the fair market value that is determined by local assessors to be the total taxable value of land and additions on the property. | Land | Improvement |
|---|---|---|---|---|
| 2025 | $596 | $10,754 | $1,450 | $9,304 |
| 2024 | $610 | $10,754 | $1,450 | $9,304 |
| 2023 | $596 | $10,754 | $1,450 | $9,304 |
| 2022 | $566 | $10,754 | $1,450 | $9,304 |
| 2021 | $515 | $9,290 | $1,450 | $7,840 |
| 2020 | $515 | $9,290 | $1,450 | $7,840 |
| 2019 | $515 | $9,290 | $1,450 | $7,840 |
| 2018 | $514 | $9,290 | $1,450 | $7,840 |
| 2017 | $442 | $9,290 | $1,450 | $7,840 |
| 2016 | $412 | $7,270 | $1,450 | $5,820 |
| 2015 | $405 | $7,270 | $1,450 | $5,820 |
| 2014 | $408 | $7,270 | $1,450 | $5,820 |
Seller's Agent in 2025
Tony Young
Young Home Sales
(501) 352-1032
5 in this area
170 Total Sales
Buyer's Agent in 2025
Dwayne Page
Clark & Co. Realty
(501) 317-7336
14 in this area
35 Total Sales
Source: Cooperative Arkansas REALTORS® MLS
MLS Number: 25044412
APN: 800-67823-000
Disclaimer: Certain information contained herein is derived from information provided by parties other than Homes.com. All information provided is deemed reliable, but is not guaranteed to be accurate and should be independently verified.
![]() IDX information is provided exclusively for personal, non-commercial use, and may not be used for any purpose other than to identify prospective properties consumers may be interested in purchasing.
IDX information is provided exclusively for personal, non-commercial use, and may not be used for any purpose other than to identify prospective properties consumers may be interested in purchasing.
Ask me questions while you tour the home.