308 W 3rd St Nooksack, WA 98247
Estimated payment $1,295/month
Highlights
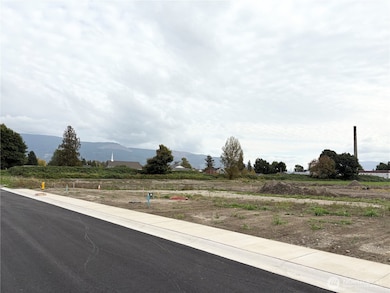
- Mountain View
- Cul-De-Sac
- Level Lot
- No HOA
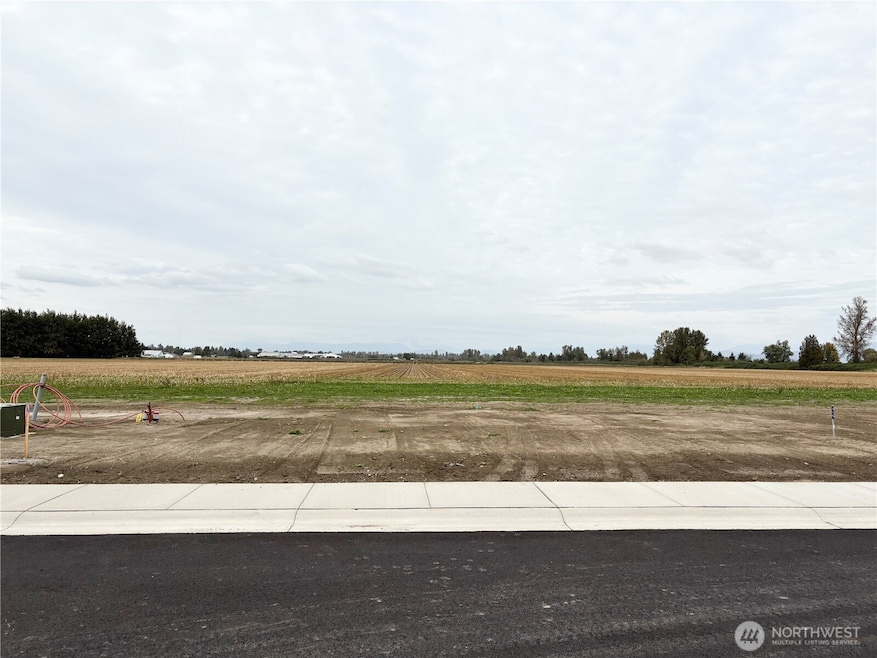
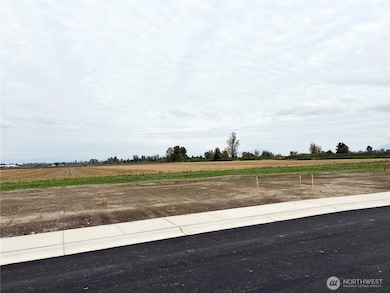
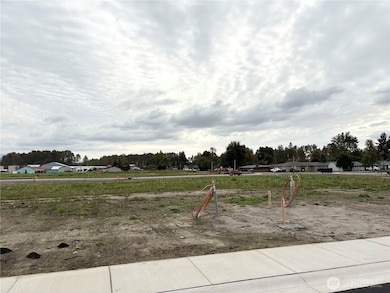
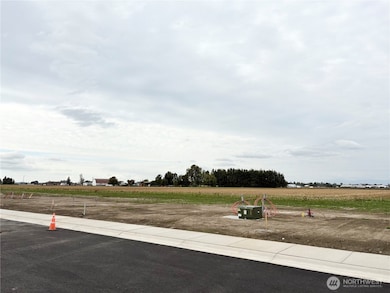
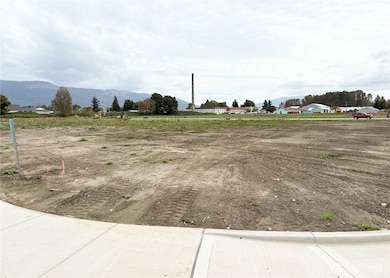
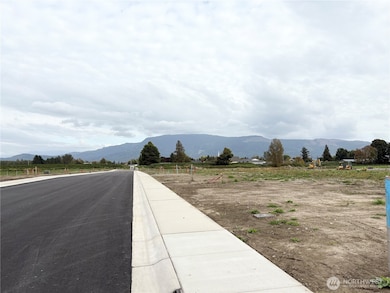
About This Lot
This level, fully serviced lot is ready for your vision—utilities are already on the property! Nestled in a brand-new neighborhood, you’ll love the unbeatable location: just 15 minutes to both Lynden and Bellingham, and close to parks, schools and shopping. Whether you're building your dream home or investing in the future, this is a rare opportunity to secure a prime piece of land in a growing community
Source: Northwest Multiple Listing Service (NWMLS)
MLS#: 2447595
Property Details
Property Type
- Land
Est. Annual Taxes
- $3,512
Lot Details
- 8,147 Sq Ft Lot
- Cul-De-Sac
- Level Lot
Property Views
- Mountain
- Territorial
Schools
- Everson Elementary School
- Nooksack Vly Mid Middle School
- Nooksack Vly High School
Community Details
- No Home Owners Association
- Blankers Crossing Condos
- Everson Subdivision
- The community has rules related to covenants, conditions, and restrictions
Listing and Financial Details
- Tax Lot 42
- Assessor Parcel Number 4004301340910000
Map
Home Values in the Area
Average Home Value in this Area
Tax History
| Year | Tax Paid | Tax Assessment Tax Assessment Total Assessment is a certain percentage of the fair market value that is determined by local assessors to be the total taxable value of land and additions on the property. | Land | Improvement |
|---|---|---|---|---|
| 2024 | $3,512 | $470,100 | $198,000 | $272,100 |
| 2023 | $3,512 | $398,023 | $137,744 | $260,279 |
| 2022 | $1,677 | $427,675 | $124,096 | $303,579 |
| 2021 | $1,740 | $353,455 | $102,560 | $203,984 |
| 2020 | $1,786 | $287,368 | $83,384 | $203,984 |
| 2019 | $2,871 | $287,368 | $83,384 | $203,984 |
| 2018 | $3,312 | $275,706 | $80,000 | $195,706 |
| 2017 | $2,959 | $236,583 | $58,000 | $178,583 |
| 2016 | $2,825 | $218,322 | $53,500 | $164,822 |
| 2015 | $2,397 | $209,389 | $51,600 | $157,789 |
| 2014 | -- | $202,896 | $50,000 | $152,896 |
| 2013 | -- | $202,896 | $50,000 | $152,896 |
Property History
| Date | Event | Price | List to Sale | Price per Sq Ft |
|---|---|---|---|---|
| 10/23/2025 10/23/25 | For Sale | $190,000 | -- | -- |
Purchase History
| Date | Type | Sale Price | Title Company |
|---|---|---|---|
| Warranty Deed | $300,280 | Whatcom Land Title | |
| Warranty Deed | $48,000 | Chicago Title Insurance | |
| Warranty Deed | $30,280 | Chicago Title Insurance |
Mortgage History
| Date | Status | Loan Amount | Loan Type |
|---|---|---|---|
| Open | $25,000 | Credit Line Revolving | |
| Open | $240,000 | Fannie Mae Freddie Mac | |
| Previous Owner | $36,000 | Purchase Money Mortgage | |
| Previous Owner | $25,000 | Purchase Money Mortgage |
Source: Northwest Multiple Listing Service (NWMLS)
MLS Number: 2447595
APN: 400429-140150-0000
Disclaimer: Certain information contained herein is derived from information provided by parties other than Homes.com. All information provided is deemed reliable, but is not guaranteed to be accurate and should be independently verified.
![]() All data is obtained from various sources and may not have been verified by broker or MLS GRID. Supplied Open House Information is subject to change without notice. All information should be independently reviewed and verified for accuracy. Properties may or may not be listed by the office/agent presenting the information. Listing information is provided by the Northwest Multiple Listing Service (NWMLS). Property information is based on available data that may include MLS information, county records, and other sources. Listings marked with the 3 tree icon and provided by NWMLS. All properties are subject to prior sale or withdrawal. IDX information is provided exclusively for consumers’ personal noncommercial use, that it may not be used for any purpose other than to identify prospective properties consumers may be interested in purchasing, that the data is deemed reliable but is not guaranteed by MLS GRID. ©2025 NWMLS.
All data is obtained from various sources and may not have been verified by broker or MLS GRID. Supplied Open House Information is subject to change without notice. All information should be independently reviewed and verified for accuracy. Properties may or may not be listed by the office/agent presenting the information. Listing information is provided by the Northwest Multiple Listing Service (NWMLS). Property information is based on available data that may include MLS information, county records, and other sources. Listings marked with the 3 tree icon and provided by NWMLS. All properties are subject to prior sale or withdrawal. IDX information is provided exclusively for consumers’ personal noncommercial use, that it may not be used for any purpose other than to identify prospective properties consumers may be interested in purchasing, that the data is deemed reliable but is not guaranteed by MLS GRID. ©2025 NWMLS.
Based on information submitted to the MLS GRID
- 304 W 3rd St
- 312 W 3rd St
- 404 W 3rd St
- 409 Amareen Ct
- 412 W 3rd St
- 506 Amareen Ct
- 405 E 2nd St
- 107 S Pass Rd Unit 14
- 107 S Pass Rd Unit 23
- 1204 E Georgia Ln
- 709 E 3rd St
- 717 E 5th St
- 705 E 5th St
- 921 Whispering Meadows Ct
- 207 E Main St
- 108 Baker St Unit 1-4
- 201 Brentwood Dr
- 107 W 4th St
- 205 Reeds Ln Unit 64
- 109 N Washington St
- 8874-8878 Depot Rd
- 8881 Depot Rd
- 1900 Front St
- 541-549 E Kellogg Rd
- 200 Tull Place
- 196 E Kellogg Rd
- 420 W Stuart Rd
- 430 W Stuart Rd
- 256 Prince Ave
- 425 W Stuart Rd
- 601 Northshore Dr Unit 102
- 1809 E Sunset Dr
- 135 Prince Ave Unit 139-202
- 2314 Weatherby Way
- 4355 Fuchsia Dr
- 3126 Racine St
- 3930 Affinity Ln
- 418 W Bakerview Rd
- 525 Darby Dr
- 2100 Electric Ave
