308 W Millbrook Rd Unit C Raleigh, NC 27609
North Hills NeighborhoodEstimated Value: $443,318
--
Bed
--
Bath
1,000
Sq Ft
$443/Sq Ft
Est. Value
About This Home
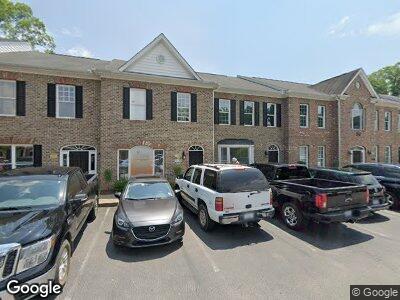
This home is located at 308 W Millbrook Rd Unit C, Raleigh, NC 27609 and is currently estimated at $443,318, approximately $443 per square foot. 308 W Millbrook Rd Unit C is a home located in Wake County with nearby schools including Green Elementary, Carroll Middle, and Sanderson High School.
Ownership History
Date
Name
Owned For
Owner Type
Purchase Details
Closed on
Apr 9, 2008
Sold by
Mooney Charles D
Bought by
Mooney Charles D and Mooney Mary B
Current Estimated Value
Purchase Details
Closed on
Oct 1, 2002
Sold by
Schweizer Properties Llc
Bought by
Mooney Charles Douts
Home Financials for this Owner
Home Financials are based on the most recent Mortgage that was taken out on this home.
Original Mortgage
$142,900
Outstanding Balance
$62,910
Interest Rate
6.21%
Mortgage Type
Commercial
Estimated Equity
$380,408
Purchase Details
Closed on
Aug 28, 2001
Sold by
Berry Glenda Futrell and Berry Davie
Bought by
Schweizer Properties Llc
Home Financials for this Owner
Home Financials are based on the most recent Mortgage that was taken out on this home.
Original Mortgage
$250,000
Interest Rate
7.18%
Mortgage Type
Commercial
Create a Home Valuation Report for This Property
The Home Valuation Report is an in-depth analysis detailing your home's value as well as a comparison with similar homes in the area
Home Values in the Area
Average Home Value in this Area
Purchase History
| Date | Buyer | Sale Price | Title Company |
|---|---|---|---|
| Mooney Charles D | -- | None Available | |
| Mooney Charles Douts | $158,000 | -- | |
| Schweizer Properties Llc | $157,500 | -- |
Source: Public Records
Mortgage History
| Date | Status | Borrower | Loan Amount |
|---|---|---|---|
| Open | Mooney Charles Douts | $142,900 | |
| Previous Owner | Berry Glenda F | $20,000 | |
| Previous Owner | Schweizer Properties Llc | $250,000 | |
| Previous Owner | Berry Glenda F | $100,000 |
Source: Public Records
Tax History Compared to Growth
Tax History
| Year | Tax Paid | Tax Assessment Tax Assessment Total Assessment is a certain percentage of the fair market value that is determined by local assessors to be the total taxable value of land and additions on the property. | Land | Improvement |
|---|---|---|---|---|
| 2024 | $2,866 | $329,960 | $0 | $329,960 |
| 2023 | $1,991 | $182,667 | $0 | $182,667 |
| 2022 | $1,850 | $182,667 | $0 | $182,667 |
| 2021 | $1,777 | $182,667 | $0 | $182,667 |
| 2020 | $1,745 | $182,667 | $0 | $182,667 |
| 2019 | $2,338 | $201,741 | $0 | $201,741 |
| 2018 | $2,204 | $201,741 | $0 | $201,741 |
| 2017 | $2,099 | $201,741 | $0 | $201,741 |
| 2016 | $2,055 | $201,741 | $0 | $201,741 |
| 2015 | $1,617 | $156,195 | $0 | $156,195 |
| 2014 | $1,534 | $156,195 | $0 | $156,195 |
Source: Public Records
Map
Nearby Homes
- 5308 Montclair Dr
- 702 Wimbleton Dr
- 5307 Dixon Dr
- 5305 Dixon Dr
- 582 Wimbleton Dr
- 861 Wimbleton Dr
- 865 Wimbleton Dr
- 1005 Temple St
- 6025 Dixon Dr
- 721 Shelley Rd
- 1005 Collins Dr Unit I3
- 129 Windel Dr
- 982 Shelley Rd
- 1101 Temple St
- 216 Burkwood Ln
- 1132 Wimbleton Dr
- 217 Dublin Rd
- 400 Cottonwood Cir
- 305 Burkwood Ln
- 662 Manchester Dr
- 308 W Millbrook Rd Unit C
- 308 W Millbrook Rd
- 308 W Millbrook Rd Unit E
- 308 W Millbrook Rd Unit F
- 312 W Millbrook Rd
- 312 W Millbrook Rd Unit 237
- 312 W Millbrook Rd Unit 137
- 312 W Millbrook Rd Unit 129
- 312 W Millbrook Rd Unit 137
- 312 W Millbrook Rd Unit 133
- 312 W Millbrook Rd Unit 129
- 310 W Millbrook Rd
- 310 W Millbrook Rd Unit 210
- 300 W Millbrook Rd
- 276 W Millbrook Rd Unit LH
- 276 W Millbrook Rd Unit 27
- 266 W Millbrook Rd
- 318 W Millbrook Rd Unit 201
- 318 W Millbrook Rd Unit 109
- 318 W Millbrook Rd