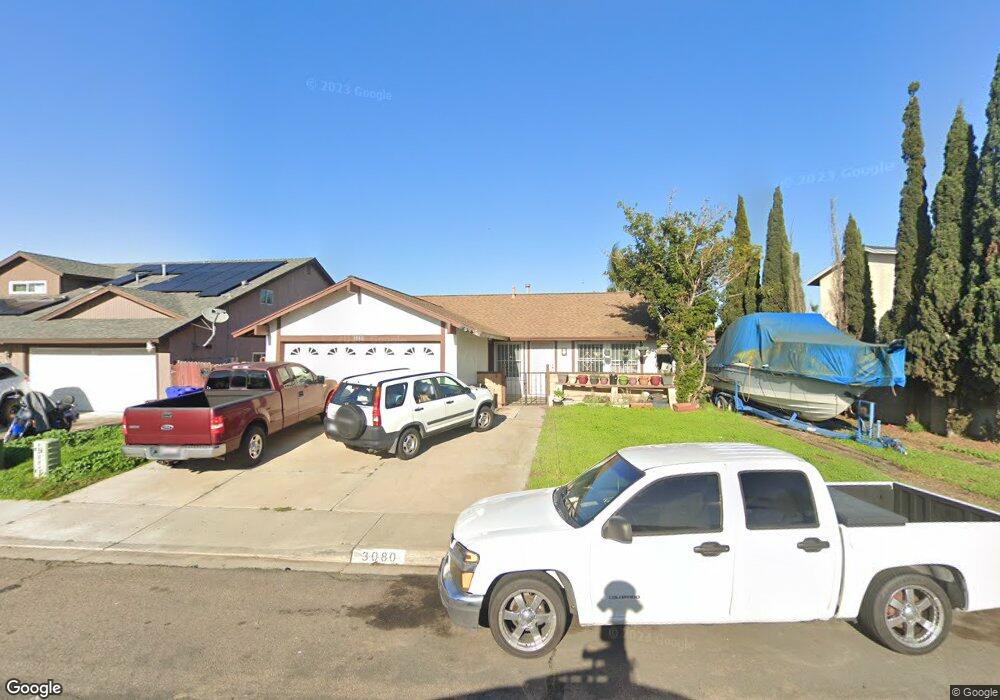
3080 Brando Dr San Diego, CA 92154
Nestor NeighborhoodEstimated Value: $669,000 - $765,000
3
Beds
2
Baths
1,178
Sq Ft
$616/Sq Ft
Est. Value
About This Home
This home is located at 3080 Brando Dr, San Diego, CA 92154 and is currently estimated at $725,789, approximately $616 per square foot. 3080 Brando Dr is a home located in San Diego County with nearby schools including Nicoloff Elementary School, Southwest Middle School, and Southwest Senior High School.
Ownership History
Date
Name
Owned For
Owner Type
Purchase Details
Closed on
Apr 20, 2004
Sold by
Stephanson Rebecca P
Bought by
Stephanson Jon K
Current Estimated Value
Home Financials for this Owner
Home Financials are based on the most recent Mortgage that was taken out on this home.
Original Mortgage
$315,000
Outstanding Balance
$145,438
Interest Rate
5.39%
Mortgage Type
Stand Alone Refi Refinance Of Original Loan
Estimated Equity
$580,351
Purchase Details
Closed on
Jun 2, 2002
Sold by
Altringer Evangeline P
Bought by
Stephanson Jon K and Stephanson Rebecca P
Home Financials for this Owner
Home Financials are based on the most recent Mortgage that was taken out on this home.
Original Mortgage
$247,095
Interest Rate
6.86%
Mortgage Type
VA
Purchase Details
Closed on
Jul 6, 1998
Sold by
Altringer Evangeline P
Bought by
Altringer Evangeline P
Purchase Details
Closed on
Jul 30, 1997
Sold by
Altringer Michael W
Bought by
Altringer Evangeline P
Purchase Details
Closed on
Oct 19, 1990
Purchase Details
Closed on
Jun 17, 1983
Create a Home Valuation Report for This Property
The Home Valuation Report is an in-depth analysis detailing your home's value as well as a comparison with similar homes in the area
Home Values in the Area
Average Home Value in this Area
Purchase History
| Date | Buyer | Sale Price | Title Company |
|---|---|---|---|
| Stephanson Jon K | -- | First American Title Co | |
| Stephanson Jon K | $243,000 | First American Title | |
| Altringer Evangeline P | -- | United Title Company | |
| Altringer Evangeline P | -- | -- | |
| -- | $143,500 | -- | |
| -- | $73,900 | -- |
Source: Public Records
Mortgage History
| Date | Status | Borrower | Loan Amount |
|---|---|---|---|
| Open | Stephanson Jon K | $315,000 | |
| Closed | Stephanson Jon K | $247,095 |
Source: Public Records
Tax History Compared to Growth
Tax History
| Year | Tax Paid | Tax Assessment Tax Assessment Total Assessment is a certain percentage of the fair market value that is determined by local assessors to be the total taxable value of land and additions on the property. | Land | Improvement |
|---|---|---|---|---|
| 2025 | $4,045 | $358,967 | $162,495 | $196,472 |
| 2024 | $4,045 | $351,929 | $159,309 | $192,620 |
| 2023 | $4,013 | $345,030 | $156,186 | $188,844 |
| 2022 | $3,936 | $338,266 | $153,124 | $185,142 |
| 2021 | $3,812 | $331,634 | $150,122 | $181,512 |
| 2020 | $3,723 | $328,234 | $148,583 | $179,651 |
| 2019 | $3,718 | $321,799 | $145,670 | $176,129 |
| 2018 | $3,654 | $315,490 | $142,814 | $172,676 |
| 2017 | $3,577 | $309,305 | $140,014 | $169,291 |
| 2016 | $3,453 | $303,241 | $137,269 | $165,972 |
| 2015 | $3,447 | $298,687 | $135,208 | $163,479 |
| 2014 | $3,026 | $262,000 | $119,000 | $143,000 |
Source: Public Records
Map
Nearby Homes
- 2950 Arbodar Rd
- 1817 Bluehaven Ct
- 879 W San Ysidro Blvd Unit 1
- 2033 Dairy Mart Rd Unit 13
- 875 W San Ysidro Blvd Unit 14
- 1312 W San Ysidro Blvd Unit B
- 3053 Tequila Way
- 1847 Via Encantadoras
- 3584 Sunset Ln Unit 131
- 3550 Sunset Ln Unit 13
- 1756 Via Del Tanido
- 3566 Sunset Ln Unit 71
- 3572 Sunset Ln Unit 81
- 1861 Katella St
- 2950 Iris Ave Unit 52
- 1697 Shooting Star Ct
- 2404 Tocayo Ave Unit 140
- 2888 Iris Ave Unit 43
- 2888 Iris Ave
- 2320 Tocayo Ave
- 3070 Brando Dr
- 3090 Brando Dr
- 3091 Arbodar Rd
- 3060 Brando Dr
- 3098 Brando Dr
- 3085 Arbodar Rd
- 3095 Arbodar Rd
- 3050 Brando Dr
- 3075 Brando Dr
- 3081 Brando Dr
- 3065 Brando Dr
- 3081 Arbodar Rd
- 3085 Brando Dr
- 2160 Valentino St
- 3055 Brando Dr
- 3040 Brando Dr
- 3075 Arbodar Rd
- 3045 Brando Dr
- 2170 Valentino St
- 2090 Valentino St