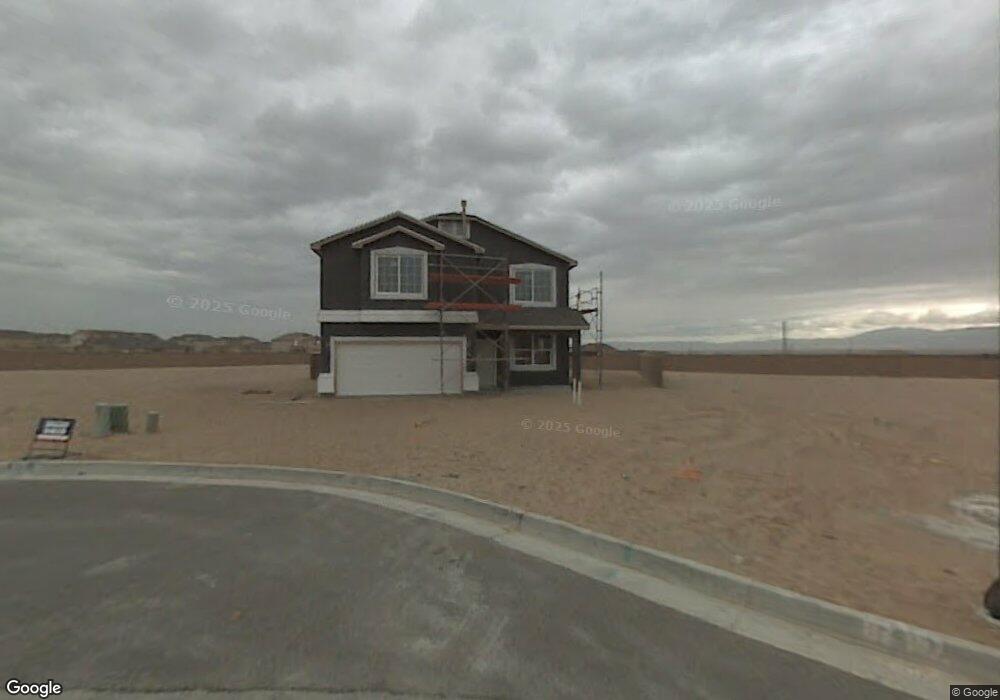
3080 Desert Sage Ave SW Los Lunas, NM 87031
West Los Lunas NeighborhoodEstimated Value: $356,000 - $359,000
3
Beds
3
Baths
2,575
Sq Ft
$139/Sq Ft
Est. Value
About This Home
This home is located at 3080 Desert Sage Ave SW, Los Lunas, NM 87031 and is currently estimated at $357,365, approximately $138 per square foot. 3080 Desert Sage Ave SW is a home located in Valencia County with nearby schools including Sundance Elementary School, Los Lunas Middle School, and Los Lunas High School.
Ownership History
Date
Name
Owned For
Owner Type
Purchase Details
Closed on
Feb 26, 2015
Sold by
Mirabal Jesus O and Mirabal Naomi
Bought by
Mirabal Onecimo and Mirabal April
Current Estimated Value
Purchase Details
Closed on
Sep 11, 2014
Sold by
Kaushal Ashok K and Kaushal Indu
Bought by
Mirabal Onecimo and Mirabal April
Home Financials for this Owner
Home Financials are based on the most recent Mortgage that was taken out on this home.
Original Mortgage
$171,584
Interest Rate
4.15%
Mortgage Type
FHA
Purchase Details
Closed on
Jan 31, 2014
Sold by
County Of Valencia
Bought by
Wells Fargo Bank Na
Purchase Details
Closed on
Feb 28, 2008
Sold by
D R Horton Inc
Bought by
Melendez Michael and Melendez Kathryn A
Home Financials for this Owner
Home Financials are based on the most recent Mortgage that was taken out on this home.
Original Mortgage
$203,162
Interest Rate
5.68%
Mortgage Type
FHA
Create a Home Valuation Report for This Property
The Home Valuation Report is an in-depth analysis detailing your home's value as well as a comparison with similar homes in the area
Home Values in the Area
Average Home Value in this Area
Purchase History
| Date | Buyer | Sale Price | Title Company |
|---|---|---|---|
| Mirabal Onecimo | -- | None Available | |
| Mirabal Onecimo | -- | Fidelity National Title Of N | |
| Wells Fargo Bank Na | -- | None Available | |
| Melendez Michael | -- | None Available |
Source: Public Records
Mortgage History
| Date | Status | Borrower | Loan Amount |
|---|---|---|---|
| Previous Owner | Mirabal Onecimo | $171,584 | |
| Previous Owner | Melendez Michael | $203,162 |
Source: Public Records
Tax History Compared to Growth
Tax History
| Year | Tax Paid | Tax Assessment Tax Assessment Total Assessment is a certain percentage of the fair market value that is determined by local assessors to be the total taxable value of land and additions on the property. | Land | Improvement |
|---|---|---|---|---|
| 2024 | $1,987 | $60,008 | $13,425 | $46,583 |
| 2023 | $1,917 | $58,261 | $11,678 | $46,583 |
| 2022 | $1,885 | $56,564 | $8,583 | $47,981 |
| 2021 | $1,903 | $56,564 | $8,583 | $47,981 |
| 2020 | $1,883 | $54,916 | $8,333 | $46,583 |
| 2019 | $1,893 | $54,916 | $8,333 | $46,583 |
| 2018 | $1,860 | $54,916 | $8,333 | $46,583 |
| 2017 | $1,832 | $54,916 | $8,333 | $46,583 |
| 2016 | $1,834 | $54,916 | $8,333 | $46,583 |
| 2015 | -- | $54,916 | $8,333 | $46,583 |
| 2013 | -- | $48,066 | $8,583 | $39,483 |
| 2011 | -- | $210,927 | $37,134 | $173,793 |
Source: Public Records
Map
Nearby Homes
- 2981 Desert Sage Ave SW
- 355 Black Hat Ave SW
- 760 Blue Sage Ave SW
- 750 Creekside Ave SW
- 2790 Clear Sky St SW
- 275 Cloud View Ave SW
- 3198 Prairie Ridge St SW
- 2670 Scarlet Sage St SW
- 660 Primrose Ave SW
- 3461 Lonetree St SW
- 3271 Prairie Ridge St SW
- 2601 Scarlet Sage Rd SW
- 711 Firewheel Loop SW
- 680 Purple Aster Ave SW
- 750 Fire Wheel Loop
- 3540 High Plains St SW
- 2512 Red Sky SW
- 2260 Firewheel Ave SW
- 241 Big Sky Ave SW
- 823 Corral St SW
- 461 Blue Sage Ave SW
- 3070 Desert Sage Ave SW
- 471 Blue Sage Ave SW
- 3060 Desert Sage Ave SW
- 481 Blue Sage Ave SW
- 3050 Desert Sage Ave SW
- 460 Blue Sage Ave SW
- 491 Blue Sage Ave SW
- 470 Blue Sage Ave SW
- 3040 Desert Sage Ave SW
- 3061 Desert Sage Ave SW
- 357 Solitude Ave SW
- 480 Blue Sage Ave SW
- 3020 Desert Sage Ave SW
- 501 Blue Sage Ave SW
- 3051 Desert Sage Ave SW
- 490 Blue Sage Ave SW
- 3041 Desert Sage Ave SW
- 3010 Desert Sage Ave SW
- 3081 Clear Sky St SW