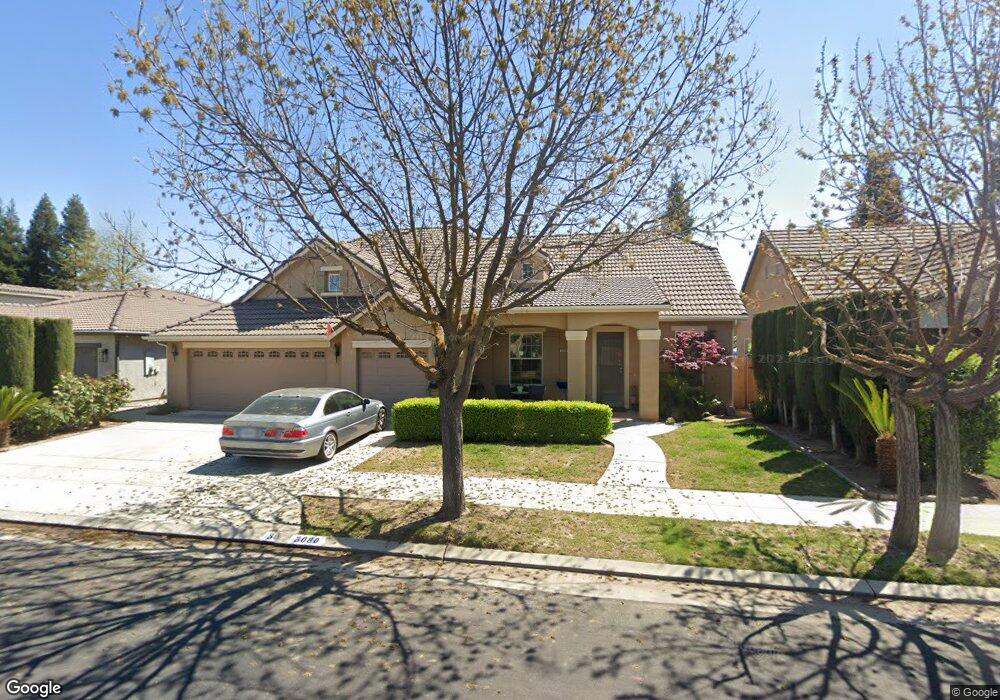
3080 Serena Ave Clovis, CA 93619
Estimated Value: $629,000 - $663,513
3
Beds
2
Baths
2,145
Sq Ft
$303/Sq Ft
Est. Value
About This Home
This home is located at 3080 Serena Ave, Clovis, CA 93619 and is currently estimated at $650,838, approximately $303 per square foot. 3080 Serena Ave is a home located in Fresno County with nearby schools including Bud Rank Elementary School, Granite Ridge Intermediate School, and Clovis North High School.
Ownership History
Date
Name
Owned For
Owner Type
Purchase Details
Closed on
Mar 25, 2025
Sold by
Mora Susan
Bought by
Susan Mora Living Trust and Mora
Current Estimated Value
Purchase Details
Closed on
Aug 19, 2010
Sold by
Federal Home Loan Mortgage Corporation
Bought by
Mora Susan
Home Financials for this Owner
Home Financials are based on the most recent Mortgage that was taken out on this home.
Original Mortgage
$276,279
Interest Rate
4.35%
Mortgage Type
FHA
Purchase Details
Closed on
Mar 31, 2010
Sold by
Omari Tareq and Najmi Najla
Bought by
Federal Home Loan Mortgage Corporation
Purchase Details
Closed on
Oct 21, 2004
Sold by
Locan Shepherd Lp
Bought by
Omari Tareq and Najmi Najla
Home Financials for this Owner
Home Financials are based on the most recent Mortgage that was taken out on this home.
Original Mortgage
$333,450
Interest Rate
5.74%
Mortgage Type
Purchase Money Mortgage
Create a Home Valuation Report for This Property
The Home Valuation Report is an in-depth analysis detailing your home's value as well as a comparison with similar homes in the area
Home Values in the Area
Average Home Value in this Area
Purchase History
| Date | Buyer | Sale Price | Title Company |
|---|---|---|---|
| Susan Mora Living Trust | -- | None Listed On Document | |
| Mora Susan | $280,000 | Lsi Title | |
| Federal Home Loan Mortgage Corporation | $299,100 | Accommodation | |
| Omari Tareq | $351,500 | Financial Title Company |
Source: Public Records
Mortgage History
| Date | Status | Borrower | Loan Amount |
|---|---|---|---|
| Previous Owner | Mora Susan | $276,279 | |
| Previous Owner | Omari Tareq | $333,450 |
Source: Public Records
Tax History
| Year | Tax Paid | Tax Assessment Tax Assessment Total Assessment is a certain percentage of the fair market value that is determined by local assessors to be the total taxable value of land and additions on the property. | Land | Improvement |
|---|---|---|---|---|
| 2025 | $4,804 | $358,718 | $115,302 | $243,416 |
| 2023 | $4,695 | $344,791 | $110,826 | $233,965 |
| 2022 | $4,541 | $338,031 | $108,653 | $229,378 |
| 2021 | $4,400 | $331,404 | $106,523 | $224,881 |
| 2020 | $4,380 | $328,007 | $105,431 | $222,576 |
| 2019 | $4,294 | $321,576 | $103,364 | $218,212 |
| 2018 | $4,193 | $315,272 | $101,338 | $213,934 |
| 2017 | $4,123 | $309,091 | $99,351 | $209,740 |
| 2016 | $3,982 | $303,031 | $97,403 | $205,628 |
| 2015 | $3,907 | $298,480 | $95,940 | $202,540 |
| 2014 | $3,829 | $292,634 | $94,061 | $198,573 |
Source: Public Records
Map
Nearby Homes
- 3202 Everglade Ave
- 1914 N Greenfield Ave
- 1719 N Whitmore Ave
- 1687 N Blackwood Ave
- 1675 N Blackwood Ave
- 2997 Trenton Ave
- 2944 Vermont Ave
- 2966 Trenton Ave
- 1617 N Megan Ave
- 2936 Trenton Ave
- 3088 Teague Ave
- 3091 Teague Ave
- 3211 Salem Ave
- 1742 N Broadbent Ln
- 1565 N Kaweah Ave
- 3544 Prescott Ave
- 3396 Trenton Ave
- 1734 N Park Ave
- 3560 Bloomfield Ln
- 1731 N Hanson Ave
- 3090 Serena Ave
- 3060 Serena Ave
- 3083 Everglade Ave
- 3093 Everglade Ave
- 3063 Everglade Ave
- 3110 Serena Ave
- 3050 Serena Ave
- 3061 Serena Ave
- 3113 Everglade Ave
- 3053 Everglade Ave
- 3091 Serena Ave
- 3120 Serena Ave
- 3040 Serena Ave
- 3051 Serena Ave
- 3111 Serena Ave
- 3123 Everglade Ave
- 3043 Everglade Ave
- 3041 Serena Ave
- 3130 Serena Ave
- 3121 Serena Ave
Your Personal Tour Guide
Ask me questions while you tour the home.