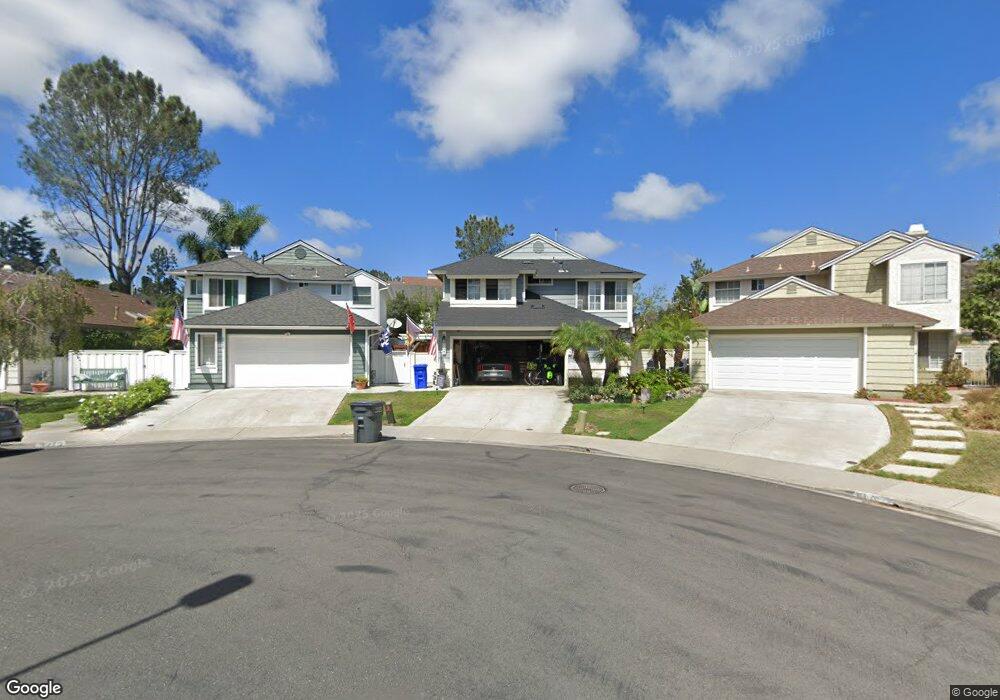
3080 Via Mariposa Carlsbad, CA 92009
La Costa NeighborhoodEstimated Value: $1,285,000 - $1,334,656
3
Beds
3
Baths
1,986
Sq Ft
$665/Sq Ft
Est. Value
About This Home
This home is located at 3080 Via Mariposa, Carlsbad, CA 92009 and is currently estimated at $1,320,914, approximately $665 per square foot. 3080 Via Mariposa is a home located in San Diego County with nearby schools including La Costa Meadows Elementary, San Elijo Middle School, and San Marcos High School.
Ownership History
Date
Name
Owned For
Owner Type
Purchase Details
Closed on
Mar 7, 2001
Sold by
Precourt Orlando Rebecca
Bought by
Orlando James C
Current Estimated Value
Home Financials for this Owner
Home Financials are based on the most recent Mortgage that was taken out on this home.
Original Mortgage
$185,000
Outstanding Balance
$67,717
Interest Rate
7.09%
Estimated Equity
$1,253,198
Purchase Details
Closed on
Feb 27, 2001
Sold by
Wong Richard L and Wong Patricia A
Bought by
Orlando James C
Home Financials for this Owner
Home Financials are based on the most recent Mortgage that was taken out on this home.
Original Mortgage
$185,000
Outstanding Balance
$67,717
Interest Rate
7.09%
Estimated Equity
$1,253,198
Purchase Details
Closed on
Dec 19, 1988
Purchase Details
Closed on
Mar 28, 1986
Create a Home Valuation Report for This Property
The Home Valuation Report is an in-depth analysis detailing your home's value as well as a comparison with similar homes in the area
Home Values in the Area
Average Home Value in this Area
Purchase History
| Date | Buyer | Sale Price | Title Company |
|---|---|---|---|
| Orlando James C | -- | Southland Title | |
| Orlando James C | $316,000 | Southland Title | |
| -- | $212,000 | -- | |
| -- | $144,500 | -- |
Source: Public Records
Mortgage History
| Date | Status | Borrower | Loan Amount |
|---|---|---|---|
| Open | Orlando James C | $185,000 |
Source: Public Records
Tax History Compared to Growth
Tax History
| Year | Tax Paid | Tax Assessment Tax Assessment Total Assessment is a certain percentage of the fair market value that is determined by local assessors to be the total taxable value of land and additions on the property. | Land | Improvement |
|---|---|---|---|---|
| 2025 | $5,353 | $509,948 | $144,627 | $365,321 |
| 2024 | $5,353 | $499,950 | $141,792 | $358,158 |
| 2023 | $5,249 | $490,148 | $139,012 | $351,136 |
| 2022 | $5,159 | $480,538 | $136,287 | $344,251 |
| 2021 | $4,731 | $439,744 | $133,615 | $306,129 |
| 2020 | $4,694 | $435,236 | $132,245 | $302,991 |
| 2019 | $4,671 | $426,702 | $129,652 | $297,050 |
| 2018 | $4,554 | $418,336 | $127,110 | $291,226 |
| 2017 | $4,464 | $410,134 | $124,618 | $285,516 |
| 2016 | $4,386 | $402,093 | $122,175 | $279,918 |
| 2015 | $4,322 | $396,054 | $120,340 | $275,714 |
| 2014 | $4,222 | $388,297 | $117,983 | $270,314 |
Source: Public Records
Map
Nearby Homes
- 6691 Corte Eduardo
- 2513 Antlers Way
- 3428 Filoli Cir
- 3137 Avenida Topanga
- 2434 Sentinel Ln
- 6412 Terraza Portico
- 6417 Terraza Portico
- 2930 Rancho Cortes
- 2145 Silverado St
- 2092 Silverado St
- 6977 Corte Langosta
- 1710 Via Allondra
- 6844 Urubu St
- 2230 Indus Way
- 2192 Cosmo Way
- 2241 Indus Way
- 7146 Sitio Destino
- 6267 Via Trato
- 2259 Indus Way
- 2125 Cosmo Way
- 6802 Via Marinero
- 3072 Via Mariposa
- 6768 Paseo Del Vista
- 6768 Paseo Del Vista
- 6804 Via Marinero
- 3064 Via Mariposa
- 6766 Paseo Del Vista
- 6766 Paseo Del Vista
- 3056 Via Mariposa
- 6806 Via Marinero
- 6764 Paseo Del Vista
- 6764 Paseo Del Vista
- 6805 Via Marinero
- 3048 Via Mariposa
- 6808 Via Marinero
- 6762 Paseo Del Vista
- 6807 Via Marinero
- 6761 Paseo Del Vista
- 6761 Paseo Del Vista
- 3040 Via Mariposa