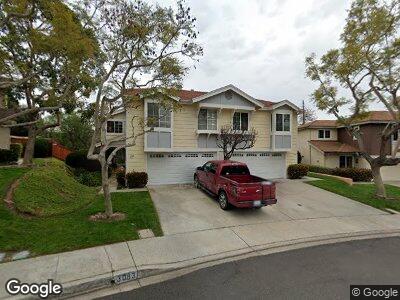
3083 W Fox Run Way San Diego, CA 92111
Clairemont Mesa West NeighborhoodEstimated Value: $1,024,000 - $1,198,337
4
Beds
3
Baths
2,061
Sq Ft
$555/Sq Ft
Est. Value
About This Home
This home is located at 3083 W Fox Run Way, San Diego, CA 92111 and is currently estimated at $1,143,084, approximately $554 per square foot. 3083 W Fox Run Way is a home located in San Diego County with nearby schools including Holmes Elementary, Marston Middle School, and Clairemont High School.
Ownership History
Date
Name
Owned For
Owner Type
Purchase Details
Closed on
Jul 5, 2007
Sold by
Tong Evelyn W
Bought by
Tong Evelyn W
Current Estimated Value
Purchase Details
Closed on
Jul 16, 2001
Sold by
Tong Evelyn W and Rogers Brian Lee
Bought by
Tong Evelyn W
Home Financials for this Owner
Home Financials are based on the most recent Mortgage that was taken out on this home.
Original Mortgage
$50,000
Interest Rate
5.95%
Mortgage Type
Credit Line Revolving
Purchase Details
Closed on
Aug 9, 1993
Sold by
Batten Mark B and Batten Janice K
Bought by
Tong Evelyn W
Home Financials for this Owner
Home Financials are based on the most recent Mortgage that was taken out on this home.
Original Mortgage
$189,900
Interest Rate
3.25%
Purchase Details
Closed on
Oct 30, 1987
Purchase Details
Closed on
Aug 15, 1983
Create a Home Valuation Report for This Property
The Home Valuation Report is an in-depth analysis detailing your home's value as well as a comparison with similar homes in the area
Home Values in the Area
Average Home Value in this Area
Purchase History
| Date | Buyer | Sale Price | Title Company |
|---|---|---|---|
| Tong Evelyn W | -- | None Available | |
| Tong Evelyn W | -- | None Available | |
| Tong Evelyn W | -- | Fidelity National Title | |
| Tong Evelyn W | $210,000 | Continental Lawyers Title | |
| -- | $169,000 | -- | |
| -- | $119,000 | -- |
Source: Public Records
Mortgage History
| Date | Status | Borrower | Loan Amount |
|---|---|---|---|
| Closed | Tong Evelyn W | $228,000 | |
| Closed | Tong Evelyn W | $225,000 | |
| Closed | Tong Evelyn W | $50,000 | |
| Closed | Tong Evelyn W | $183,200 | |
| Previous Owner | Tong Evelyn W | $189,900 |
Source: Public Records
Tax History Compared to Growth
Tax History
| Year | Tax Paid | Tax Assessment Tax Assessment Total Assessment is a certain percentage of the fair market value that is determined by local assessors to be the total taxable value of land and additions on the property. | Land | Improvement |
|---|---|---|---|---|
| 2024 | $4,246 | $349,902 | $143,543 | $206,359 |
| 2023 | $4,150 | $343,042 | $140,729 | $202,313 |
| 2022 | $4,039 | $336,317 | $137,970 | $198,347 |
| 2021 | $4,009 | $329,723 | $135,265 | $194,458 |
| 2020 | $3,960 | $326,344 | $133,879 | $192,465 |
| 2019 | $3,888 | $319,946 | $131,254 | $188,692 |
| 2018 | $3,635 | $313,674 | $128,681 | $184,993 |
| 2017 | $80 | $307,524 | $126,158 | $181,366 |
| 2016 | $3,488 | $301,495 | $123,685 | $177,810 |
| 2015 | $3,435 | $296,968 | $121,828 | $175,140 |
| 2014 | $3,381 | $291,152 | $119,442 | $171,710 |
Source: Public Records
Map
Nearby Homes
- 3164 W Fox Run Way
- 3111 Old Bridgeport Way
- 3057 Old Bridgeport Way
- 3026-28 Comstock St
- 2956 Ulric St
- 2750 Wheatstone St Unit 109
- 2750 Wheatstone St Unit 22
- 2750 Wheatstone St Unit 207
- 2750 Wheatstone St
- 3611 Mount Aclare Ave
- 7016 Park Mesa Way Unit 23
- 7036 Park Mesa Way Unit 33
- 7076 Park Mesa Way Unit 55
- 5403 Via Carancho
- 3625 Mount Everest Blvd
- 7029 Hilton Place
- 4950 Mount Ashmun Dr
- 2995 Cowley Way Unit 67
- 7162 Beagle St
- 2930 Cowley Way Unit 101
- 3083 W Fox Run Way
- 3077 W Fox Run Way
- 3089 W Fox Run Way
- 3071 W Fox Run Way
- 3097 W Fox Run Way
- 3065 W Fox Run Way
- 3098 W Fox Run Way
- 3092 W Fox Run Way
- 3086 W Fox Run Way
- 3116 Old Kettle Rd
- 3110 Old Kettle Rd Unit 2
- 3080 W Fox Run Way
- 3074 W Fox Run Way
- 3106 Old Kettle Rd
- 3120 Old Kettle Rd
- 3068 W Fox Run Way
- 3104 W Fox Run Way
- 3126 Old Kettle Rd
- 3062 W Fox Run Way
- 3103 Old Kettle Rd