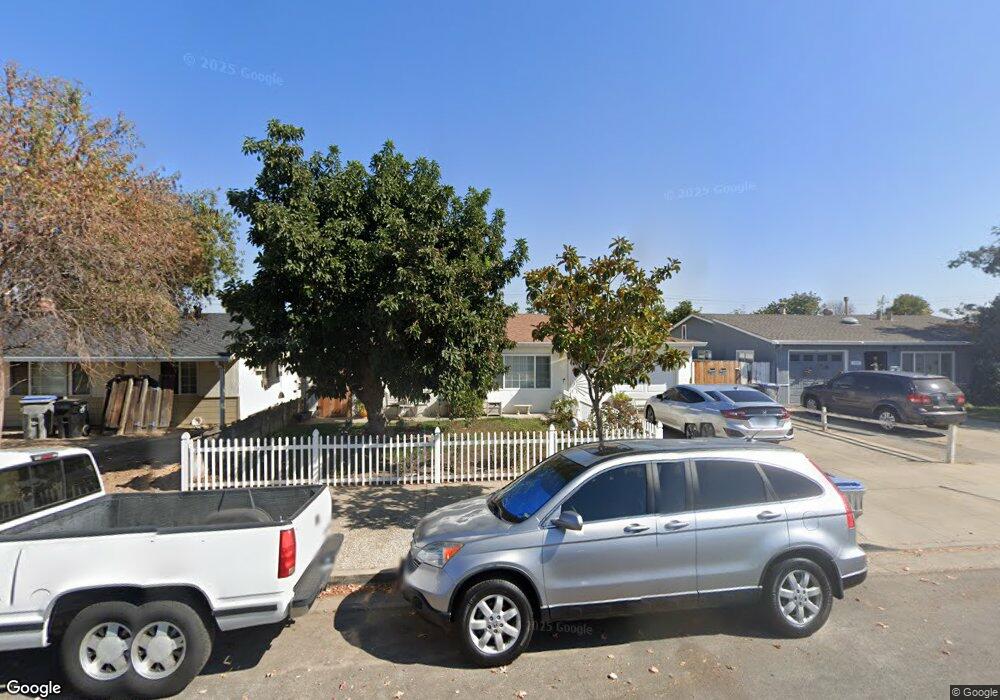
3088 Kilo Ave San Jose, CA 95124
Doerr-Steindorf NeighborhoodEstimated Value: $1,366,000 - $1,484,000
3
Beds
1
Bath
1,060
Sq Ft
$1,328/Sq Ft
Est. Value
About This Home
This home is located at 3088 Kilo Ave, San Jose, CA 95124 and is currently estimated at $1,407,369, approximately $1,327 per square foot. 3088 Kilo Ave is a home located in Santa Clara County with nearby schools including Branham High School, Fammatre Elementary School, and Sartorette Charter School.
Ownership History
Date
Name
Owned For
Owner Type
Purchase Details
Closed on
Feb 13, 2006
Sold by
Herrera Jesus C
Bought by
Herrera Jesus C and Herrera Maria
Current Estimated Value
Home Financials for this Owner
Home Financials are based on the most recent Mortgage that was taken out on this home.
Original Mortgage
$510,300
Outstanding Balance
$287,279
Interest Rate
6.2%
Mortgage Type
New Conventional
Estimated Equity
$1,120,090
Purchase Details
Closed on
Jul 5, 2005
Sold by
Herrera Jesus C
Bought by
Herrera Jesus C and Herrera Maria
Purchase Details
Closed on
Jul 29, 2004
Sold by
Herrera Maria
Bought by
Herrera Jesus C
Home Financials for this Owner
Home Financials are based on the most recent Mortgage that was taken out on this home.
Original Mortgage
$499,900
Interest Rate
6.24%
Mortgage Type
Purchase Money Mortgage
Create a Home Valuation Report for This Property
The Home Valuation Report is an in-depth analysis detailing your home's value as well as a comparison with similar homes in the area
Home Values in the Area
Average Home Value in this Area
Purchase History
| Date | Buyer | Sale Price | Title Company |
|---|---|---|---|
| Herrera Jesus C | -- | New Century Title | |
| Herrera Jesus C | -- | -- | |
| Herrera Jesus C | -- | First American Title Company | |
| Herrera Jesus C | $500,000 | First American Title Company |
Source: Public Records
Mortgage History
| Date | Status | Borrower | Loan Amount |
|---|---|---|---|
| Open | Herrera Jesus C | $510,300 | |
| Closed | Herrera Jesus C | $499,900 |
Source: Public Records
Tax History Compared to Growth
Tax History
| Year | Tax Paid | Tax Assessment Tax Assessment Total Assessment is a certain percentage of the fair market value that is determined by local assessors to be the total taxable value of land and additions on the property. | Land | Improvement |
|---|---|---|---|---|
| 2025 | $9,878 | $696,796 | $418,024 | $278,772 |
| 2024 | $9,878 | $683,134 | $409,828 | $273,306 |
| 2023 | $9,788 | $669,741 | $401,793 | $267,948 |
| 2022 | $9,617 | $656,610 | $393,915 | $262,695 |
| 2021 | $9,406 | $643,737 | $386,192 | $257,545 |
| 2020 | $8,974 | $637,138 | $382,233 | $254,905 |
| 2019 | $8,853 | $624,646 | $374,739 | $249,907 |
| 2018 | $8,609 | $612,399 | $367,392 | $245,007 |
| 2017 | $8,424 | $600,392 | $360,189 | $240,203 |
| 2016 | $8,024 | $588,621 | $353,127 | $235,494 |
| 2015 | $7,924 | $579,780 | $347,823 | $231,957 |
| 2014 | $7,385 | $568,424 | $341,010 | $227,414 |
Source: Public Records
Map
Nearby Homes
- 3161 Quinto Way
- 1701 Foxworthy Ave
- 2917 Quinto Way
- 3155 Franela Dr
- 1795 Foxworthy Ave
- 3310 Kirk Rd
- 2881 Meridian Ave Unit 217
- 2881 Meridian Ave Unit 224
- 2881 Meridian Ave Unit 264
- 2772 Quinto Way
- 1828 Nestorita Way
- 3277 Ensalmo Ave
- 3825 Woodford Dr
- 1756 Hallmark Ln
- 1800 Donna Ln
- 1799 Bradford Way
- 1741 Harte Dr
- 1649 Glenville Dr
- 3328 Kimber Ct Unit 21
- 3942 Paladin Dr