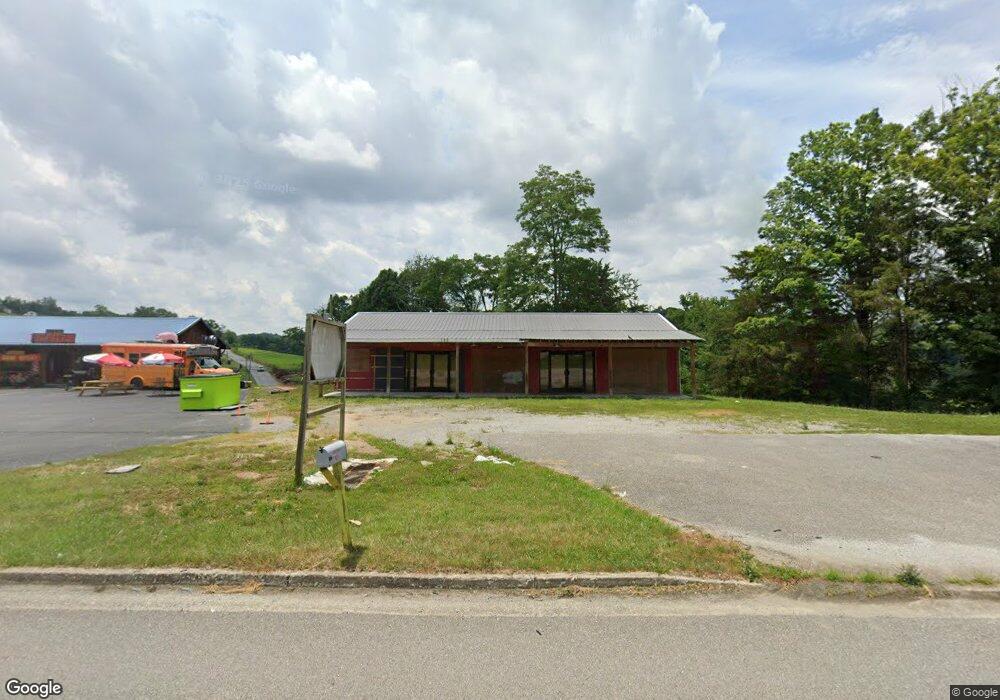
3089 Highway 25e Tazewell, TN 37879
Estimated Value: $184,336
--
Bed
--
Bath
2,000
Sq Ft
$92/Sq Ft
Est. Value
About This Home
This home is located at 3089 Highway 25e, Tazewell, TN 37879 and is currently estimated at $184,336, approximately $92 per square foot. 3089 Highway 25e is a home located in Claiborne County.
Ownership History
Date
Name
Owned For
Owner Type
Purchase Details
Closed on
Mar 19, 2021
Sold by
Saa Logistics Inc
Bought by
Risner Mitchell and Risner Dawn
Current Estimated Value
Home Financials for this Owner
Home Financials are based on the most recent Mortgage that was taken out on this home.
Original Mortgage
$103,200
Outstanding Balance
$84,575
Interest Rate
2.7%
Mortgage Type
Commercial
Estimated Equity
$99,761
Purchase Details
Closed on
May 19, 2017
Sold by
Fultz Judy A
Bought by
Saa Logistics Inc
Home Financials for this Owner
Home Financials are based on the most recent Mortgage that was taken out on this home.
Original Mortgage
$84,000
Interest Rate
3.97%
Mortgage Type
Future Advance Clause Open End Mortgage
Purchase Details
Closed on
Feb 20, 1987
Bought by
Fultz Bennie R and Fultz Judy A
Purchase Details
Closed on
Jan 1, 1984
Bought by
Duncan David and Duncan Wanda
Purchase Details
Closed on
Jan 3, 1937
Purchase Details
Closed on
Jan 2, 1900
Create a Home Valuation Report for This Property
The Home Valuation Report is an in-depth analysis detailing your home's value as well as a comparison with similar homes in the area
Home Values in the Area
Average Home Value in this Area
Purchase History
| Date | Buyer | Sale Price | Title Company |
|---|---|---|---|
| Risner Mitchell | $129,000 | None Available | |
| Saa Logistics Inc | $85,000 | -- | |
| Fultz Bennie R | $17,500 | -- | |
| Duncan David | -- | -- | |
| -- | -- | -- | |
| -- | -- | -- |
Source: Public Records
Mortgage History
| Date | Status | Borrower | Loan Amount |
|---|---|---|---|
| Open | Risner Mitchell | $103,200 | |
| Previous Owner | Saa Logistics Inc | $84,000 |
Source: Public Records
Tax History Compared to Growth
Tax History
| Year | Tax Paid | Tax Assessment Tax Assessment Total Assessment is a certain percentage of the fair market value that is determined by local assessors to be the total taxable value of land and additions on the property. | Land | Improvement |
|---|---|---|---|---|
| 2024 | $1,199 | $51,240 | $24,960 | $26,280 |
| 2023 | $1,199 | $51,240 | $24,960 | $26,280 |
| 2022 | $1,025 | $51,240 | $24,960 | $26,280 |
| 2021 | $838 | $32,520 | $20,760 | $11,760 |
| 2020 | $838 | $32,520 | $20,760 | $11,760 |
| 2019 | $838 | $32,520 | $20,760 | $11,760 |
| 2018 | $838 | $32,520 | $20,760 | $11,760 |
| 2017 | $838 | $32,520 | $20,760 | $11,760 |
| 2016 | $865 | $33,520 | $20,760 | $12,760 |
| 2015 | $831 | $33,520 | $20,760 | $12,760 |
| 2014 | $831 | $33,519 | $0 | $0 |
Source: Public Records
Map
Nearby Homes
- 1258 Dogwood Rd
- 429 Dogwood Heights Dr
- 282 Jay Dr
- 175 Norris Dr
- 0 Highway 25 Hwy E Unit 1313870
- Tbd Cave Springs Rd
- 136 Cardwell Dr
- 181 Gloria Dr
- 450 Buffalo Ln
- 485 Norris Dr
- 0 Old Cave Springs Rd
- 122 Opal St
- 818 Cave Springs Rd
- 141 Henley St
- 127 Henley St
- 117 Henley St
- 107 Henley St
- 201 Henley St
- 136 Dudley Ln
- 158 Dudley Cir
- 3089 U S 25e Scenic
- 3089 U S 25 E
- 3049 U S 25 E
- 3049 Highway 25e
- 157 Dogwood Heights Dr
- 1316 Dogwood Rd
- 3031 Highway 25e
- 225 Dogwood Heights Dr
- 141 Dogwood Heights Dr
- 151 Dogwood Heights Dr
- 130 Carmon Cir
- 120 Carmon Cir
- 248 Dogwood Heights Dr
- 123 Dogwood Heights Dr
- 125 Carmon Cir
- 115 Carmon Cir
- 1276 Dogwood Rd
- 3180 Highway 25e
- 268 Dogwood Heights Dr
- 0 Carmon Cir Unit 1089248