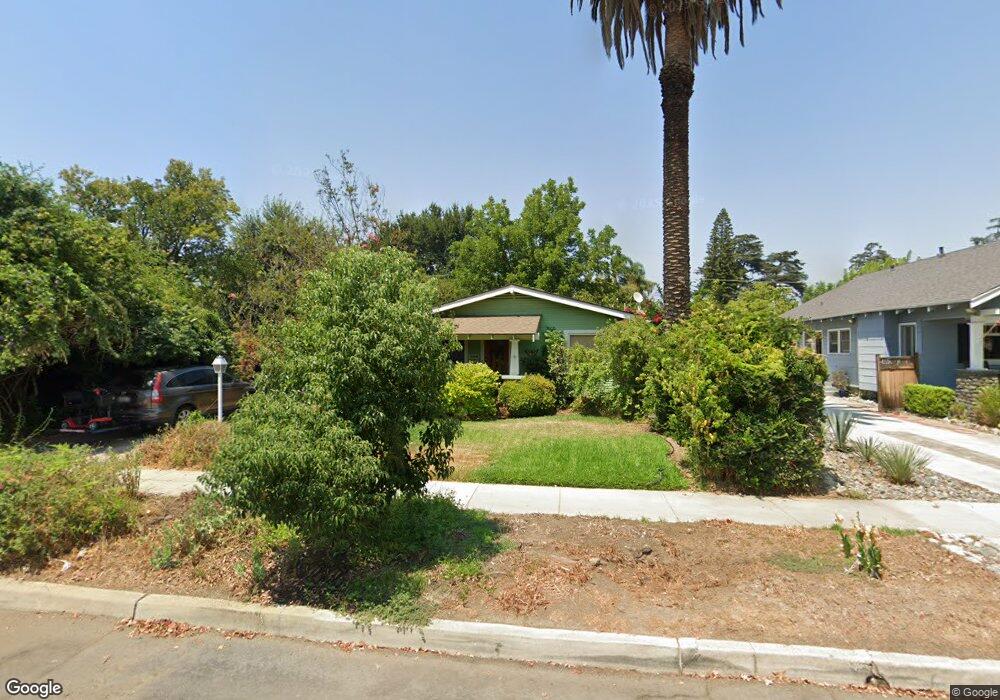
309 E H St Ontario, CA 91764
Downtown Ontario NeighborhoodEstimated Value: $634,438 - $693,000
2
Beds
1
Bath
1,227
Sq Ft
$535/Sq Ft
Est. Value
About This Home
This home is located at 309 E H St, Ontario, CA 91764 and is currently estimated at $656,110, approximately $534 per square foot. 309 E H St is a home located in San Bernardino County with nearby schools including Central Language Academy, Vina Danks Middle, and Chaffey High School.
Ownership History
Date
Name
Owned For
Owner Type
Purchase Details
Closed on
Jul 30, 1998
Sold by
Chavez Nick A and Chavez Katherine L
Bought by
Crespo Marianne and Kernen Charles F
Current Estimated Value
Home Financials for this Owner
Home Financials are based on the most recent Mortgage that was taken out on this home.
Original Mortgage
$123,846
Interest Rate
6.6%
Mortgage Type
FHA
Purchase Details
Closed on
Mar 14, 1994
Sold by
Williams David J
Bought by
Chavez Nick A and Chavez Katherine L
Create a Home Valuation Report for This Property
The Home Valuation Report is an in-depth analysis detailing your home's value as well as a comparison with similar homes in the area
Home Values in the Area
Average Home Value in this Area
Purchase History
| Date | Buyer | Sale Price | Title Company |
|---|---|---|---|
| Crespo Marianne | $126,000 | Lawyers Title Company | |
| Chavez Nick A | $122,500 | Commonwealth Land Title Co |
Source: Public Records
Mortgage History
| Date | Status | Borrower | Loan Amount |
|---|---|---|---|
| Previous Owner | Crespo Marianne | $123,846 |
Source: Public Records
Tax History
| Year | Tax Paid | Tax Assessment Tax Assessment Total Assessment is a certain percentage of the fair market value that is determined by local assessors to be the total taxable value of land and additions on the property. | Land | Improvement |
|---|---|---|---|---|
| 2025 | $2,109 | $197,535 | $62,711 | $134,824 |
| 2024 | $2,060 | $193,661 | $61,481 | $132,180 |
| 2023 | $2,001 | $189,863 | $60,275 | $129,588 |
| 2022 | $1,973 | $186,140 | $59,093 | $127,047 |
| 2021 | $1,959 | $182,490 | $57,934 | $124,556 |
| 2020 | $1,924 | $180,619 | $57,340 | $123,279 |
| 2019 | $1,906 | $177,078 | $56,216 | $120,862 |
| 2018 | $1,878 | $173,606 | $55,114 | $118,492 |
| 2017 | $1,810 | $170,202 | $54,033 | $116,169 |
| 2016 | $1,737 | $166,865 | $52,974 | $113,891 |
| 2015 | $1,800 | $164,358 | $52,178 | $112,180 |
| 2014 | $1,744 | $161,139 | $51,156 | $109,983 |
Source: Public Records
Map
Nearby Homes
Your Personal Tour Guide
Ask me questions while you tour the home.