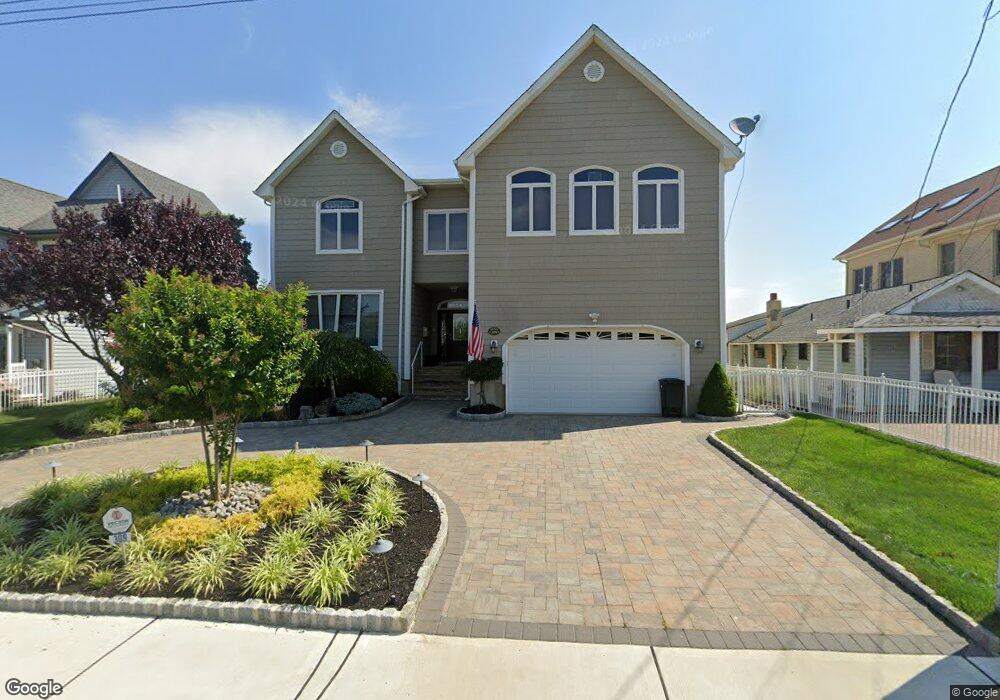
309 Front St Union Beach, NJ 07735
Estimated Value: $867,000 - $1,118,000
4
Beds
3
Baths
3,780
Sq Ft
$271/Sq Ft
Est. Value
About This Home
This home is located at 309 Front St, Union Beach, NJ 07735 and is currently estimated at $1,025,334, approximately $271 per square foot. 309 Front St is a home located in Monmouth County with nearby schools including Memorial School and Baytul-Iman Academy.
Ownership History
Date
Name
Owned For
Owner Type
Purchase Details
Closed on
Apr 8, 2022
Sold by
Brady Patrick J
Bought by
Debellas Cristina
Current Estimated Value
Purchase Details
Closed on
Apr 11, 2002
Sold by
Tran Thanh
Bought by
Brady Patrick
Home Financials for this Owner
Home Financials are based on the most recent Mortgage that was taken out on this home.
Original Mortgage
$110,400
Interest Rate
7.05%
Purchase Details
Closed on
Dec 5, 2000
Sold by
Ish Louise
Bought by
Tran Thanh and Pham Mai
Create a Home Valuation Report for This Property
The Home Valuation Report is an in-depth analysis detailing your home's value as well as a comparison with similar homes in the area
Home Values in the Area
Average Home Value in this Area
Purchase History
| Date | Buyer | Sale Price | Title Company |
|---|---|---|---|
| Debellas Cristina | $705,000 | Schram Marc B | |
| Debellas Cristina | $705,000 | Schram Marc B | |
| Brady Patrick | $205,000 | -- | |
| Tran Thanh | $175,000 | -- |
Source: Public Records
Mortgage History
| Date | Status | Borrower | Loan Amount |
|---|---|---|---|
| Previous Owner | Brady Patrick | $110,400 |
Source: Public Records
Tax History
| Year | Tax Paid | Tax Assessment Tax Assessment Total Assessment is a certain percentage of the fair market value that is determined by local assessors to be the total taxable value of land and additions on the property. | Land | Improvement |
|---|---|---|---|---|
| 2025 | $19,874 | $998,600 | $356,700 | $641,900 |
| 2024 | $19,448 | $963,800 | $344,500 | $619,300 |
Source: Public Records
Map
Nearby Homes
Your Personal Tour Guide
Ask me questions while you tour the home.