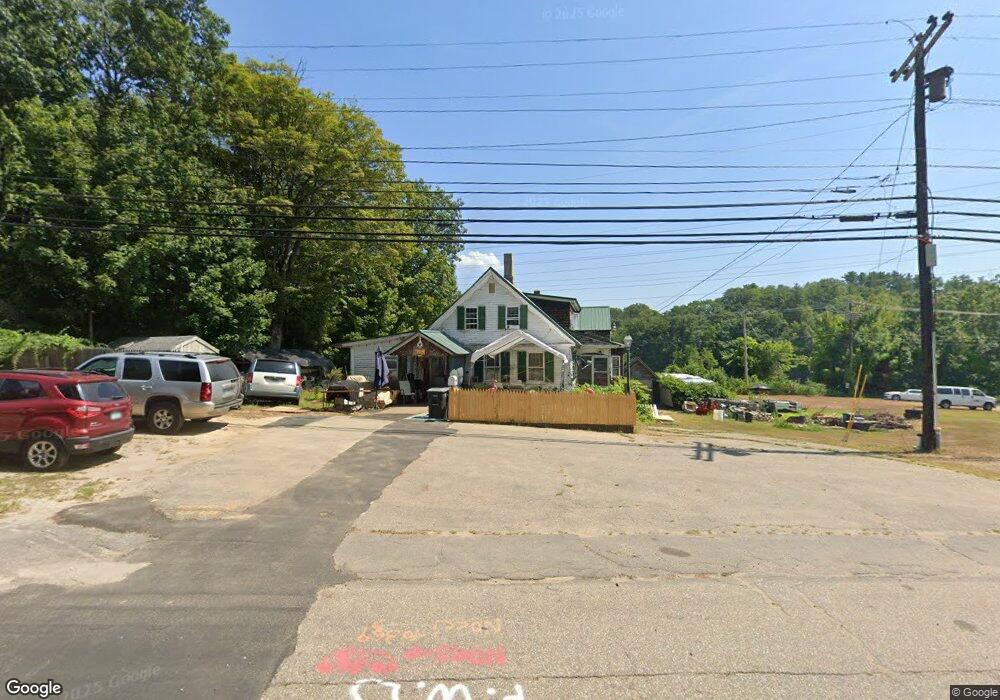
309 N Main St Franklin, NH 03235
Estimated Value: $380,000 - $396,000
4
Beds
3
Baths
2,000
Sq Ft
$194/Sq Ft
Est. Value
About This Home
This home is located at 309 N Main St, Franklin, NH 03235 and is currently estimated at $387,217, approximately $193 per square foot. 309 N Main St is a home located in Merrimack County with nearby schools including Paul A. Smith School, Franklin Middle School, and Franklin High School.
Ownership History
Date
Name
Owned For
Owner Type
Purchase Details
Closed on
Sep 30, 2009
Sold by
Goss Basil F and Goss Susan E
Bought by
Chainey Ronald J and Chainey Katherine B
Current Estimated Value
Home Financials for this Owner
Home Financials are based on the most recent Mortgage that was taken out on this home.
Original Mortgage
$91,836
Outstanding Balance
$60,090
Interest Rate
5.12%
Mortgage Type
Purchase Money Mortgage
Estimated Equity
$327,127
Create a Home Valuation Report for This Property
The Home Valuation Report is an in-depth analysis detailing your home's value as well as a comparison with similar homes in the area
Home Values in the Area
Average Home Value in this Area
Purchase History
| Date | Buyer | Sale Price | Title Company |
|---|---|---|---|
| Chainey Ronald J | $90,000 | -- |
Source: Public Records
Mortgage History
| Date | Status | Borrower | Loan Amount |
|---|---|---|---|
| Open | Chainey Ronald J | $91,836 |
Source: Public Records
Tax History Compared to Growth
Tax History
| Year | Tax Paid | Tax Assessment Tax Assessment Total Assessment is a certain percentage of the fair market value that is determined by local assessors to be the total taxable value of land and additions on the property. | Land | Improvement |
|---|---|---|---|---|
| 2024 | $4,178 | $243,600 | $72,600 | $171,000 |
| 2023 | $3,961 | $243,600 | $72,600 | $171,000 |
| 2022 | $3,239 | $132,800 | $59,000 | $73,800 |
| 2021 | $3,082 | $132,800 | $59,000 | $73,800 |
| 2020 | $3,033 | $132,800 | $59,000 | $73,800 |
| 2019 | $2,984 | $132,800 | $59,000 | $73,800 |
| 2018 | $2,916 | $132,800 | $59,000 | $73,800 |
| 2017 | $424 | $101,700 | $30,600 | $71,100 |
| 2016 | $2,566 | $101,700 | $30,600 | $71,100 |
| 2015 | $1,776 | $71,190 | $21,420 | $49,770 |
| 2011 | $2,813 | $130,700 | $32,000 | $98,700 |
Source: Public Records
Map
Nearby Homes
- 261 N Main St
- 150 Victory Dr
- 11 Racine St
- 187 Summit St
- 157 Summit St
- 319 Victory Dr
- 4 Trail St
- 140 Summit St
- 0 Rowell Dr Unit 406 5043422
- 416 Central St
- 75 School St
- 88 Franklin St
- 123 Franklin St
- 135 Franklin St
- 213 S Main St
- 46 Sanborn St
- 21 Lake Ave
- 82-84 Woodridge Rd
- Lot 4 Piper St
- 28 Maple Square