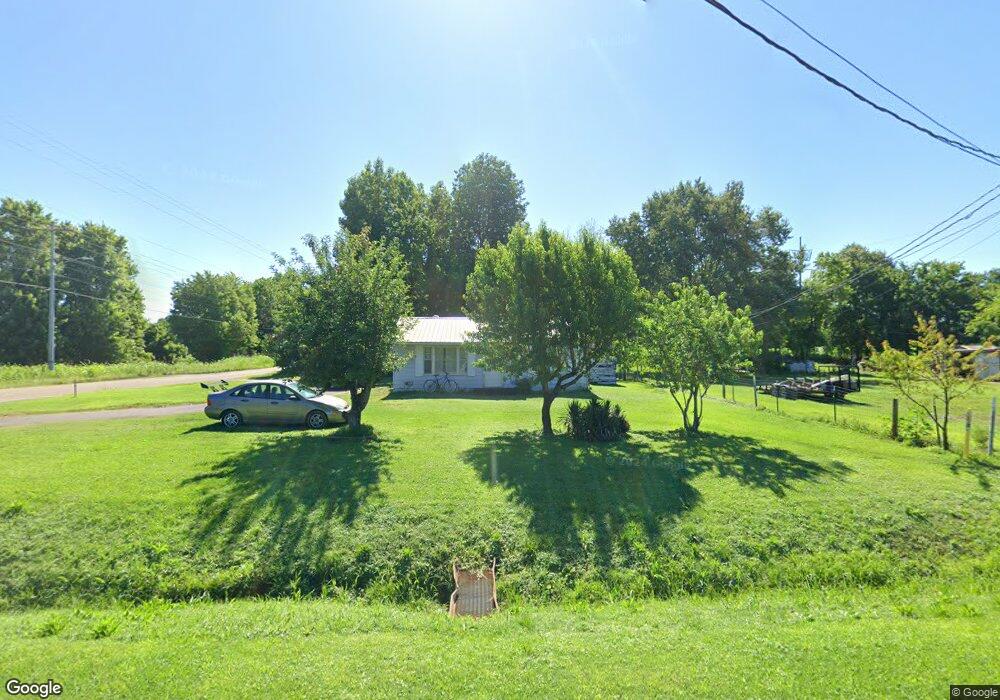
3096 Section Line Rd Union City, TN 38261
Estimated Value: $74,372 - $112,000
--
Bed
1
Bath
768
Sq Ft
$124/Sq Ft
Est. Value
About This Home
This home is located at 3096 Section Line Rd, Union City, TN 38261 and is currently estimated at $95,093, approximately $123 per square foot. 3096 Section Line Rd is a home located in Obion County with nearby schools including Union City Elementary School, Union City Middle School, and Union City High School.
Ownership History
Date
Name
Owned For
Owner Type
Purchase Details
Closed on
Mar 20, 2024
Sold by
Acevedo Lucenda
Bought by
Rodriguez Daniel Acevedo
Current Estimated Value
Purchase Details
Closed on
Feb 20, 2010
Sold by
Quinton William
Bought by
Acevedo Lucenda
Purchase Details
Closed on
Oct 29, 1998
Bought by
Werner Heather
Purchase Details
Closed on
Nov 16, 1995
Bought by
Wayne Shanklin Billy
Purchase Details
Closed on
Aug 27, 1992
Bought by
Burrell John N and Hazel Inez
Purchase Details
Closed on
Aug 13, 1991
Bought by
Edwards George R and Edwards Tammie
Purchase Details
Closed on
Dec 20, 1990
Purchase Details
Closed on
Jan 19, 1988
Bought by
Adams Charles N and Adams Rita L
Purchase Details
Closed on
Jun 21, 1985
Purchase Details
Closed on
Nov 8, 1984
Purchase Details
Closed on
Jun 19, 1984
Create a Home Valuation Report for This Property
The Home Valuation Report is an in-depth analysis detailing your home's value as well as a comparison with similar homes in the area
Home Values in the Area
Average Home Value in this Area
Purchase History
| Date | Buyer | Sale Price | Title Company |
|---|---|---|---|
| Rodriguez Daniel Acevedo | $28,000 | None Listed On Document | |
| Rodriguez Daniel Acevedo | $28,000 | None Listed On Document | |
| Acevedo Lucenda | $15,000 | -- | |
| Werner Heather | $97,000 | -- | |
| Wayne Shanklin Billy | $28,000 | -- | |
| Burrell John N | $21,000 | -- | |
| Edwards George R | -- | -- | |
| -- | -- | -- | |
| Adams Charles N | -- | -- | |
| -- | -- | -- | |
| -- | -- | -- | |
| -- | -- | -- |
Source: Public Records
Tax History Compared to Growth
Tax History
| Year | Tax Paid | Tax Assessment Tax Assessment Total Assessment is a certain percentage of the fair market value that is determined by local assessors to be the total taxable value of land and additions on the property. | Land | Improvement |
|---|---|---|---|---|
| 2025 | -- | $15,175 | $0 | $0 |
| 2024 | -- | $15,250 | $1,650 | $13,600 |
| 2023 | $428 | $15,250 | $1,650 | $13,600 |
| 2022 | $105 | $6,550 | $1,325 | $5,225 |
| 2021 | $103 | $6,550 | $1,325 | $5,225 |
| 2020 | $105 | $6,550 | $1,325 | $5,225 |
| 2019 | $237 | $6,550 | $1,325 | $5,225 |
| 2018 | $235 | $6,350 | $1,325 | $5,025 |
| 2017 | $235 | $6,175 | $1,325 | $4,850 |
| 2016 | $235 | $6,175 | $1,325 | $4,850 |
| 2015 | $234 | $6,175 | $1,325 | $4,850 |
| 2014 | $234 | $6,175 | $1,325 | $4,850 |
Source: Public Records
Map
Nearby Homes
- 4446 Town And Country Rd
- 4410 Countrywood
- 224 Wilma Unit Lot 36
- 221 Wilma Dr
- 207 Stevens St
- 109 Wilma Dr
- 232 Wilma Dr
- 0 Stevens St Unit Lot 31 RRA44510
- 0 Stevens St Unit Lot 30 RRA43033
- 0 Stevens St Unit Lot 32 RRA43013
- 218 Hayes St
- 49 Wilma Dr Unit Lot 49
- 42 Wilma Dr Unit Lot 42
- 39 Wilma Dr Unit Lot 39
- 38 Wilma Dr Unit Lot 38
- 37 Wilma Dr Unit Lot 37
- 2202 Nailling Dr
- 1813 E Vine St
- 2505 Vernon Street Extension
- 1162 Highland Ave
- 3082 Section Line Rd
- 3038 Section Line Rd
- 3152 Sunnyview St
- 4491 Countrywood St
- 4471 Countrywood St
- 3147 Sunnyview St
- 3170 Sunnyview St
- 4481 Countrywood St
- 4461 Countrywood St
- 3180 Sunnyview St
- 4600 Knox Daniel Rd
- 4451 Countrywood St
- 4404 Town And Country Rd
- 3159 Sunnyview St
- 4492 Countrywood St
- 0 Countrywood Unit RRA39040
- 0 Countrywood Unit RRA39046
- 0 Countrywood Unit RRA39043
- 0 Countrywood Unit RRA39044
- 0 Countrywood Unit RRA39045