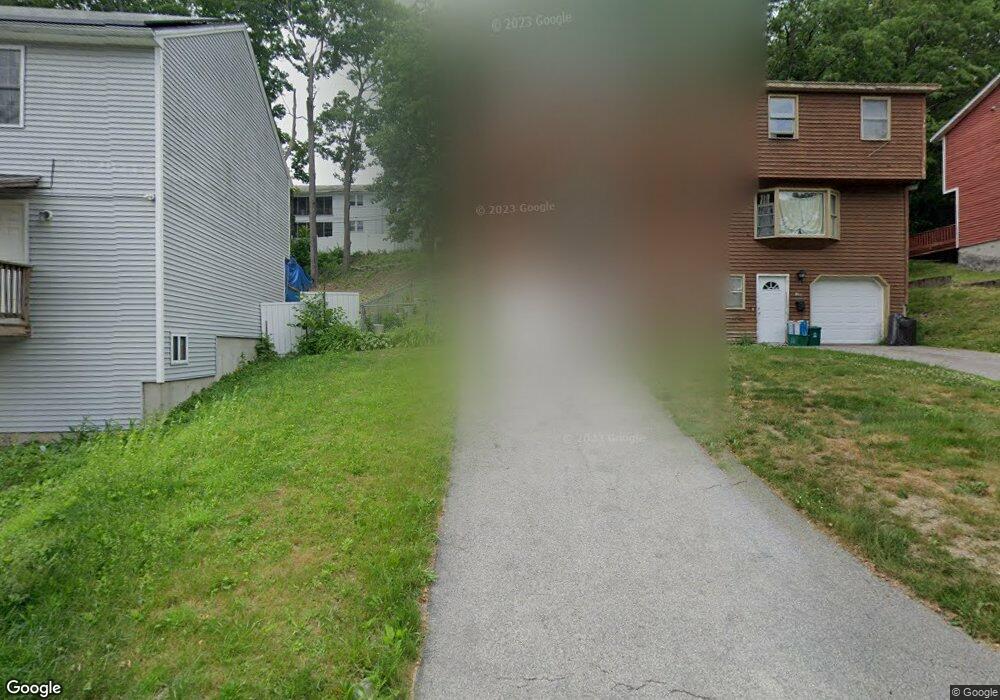
30A Roy St Unit A Worcester, MA 01603
Columbus Park NeighborhoodEstimated Value: $329,000 - $372,000
2
Beds
2
Baths
1,118
Sq Ft
$314/Sq Ft
Est. Value
About This Home
This home is located at 30A Roy St Unit A, Worcester, MA 01603 and is currently estimated at $351,391, approximately $314 per square foot. 30A Roy St Unit A is a home located in Worcester County with nearby schools including Columbus Park Preparatory Academy, Chandler Magnet, and Jacob Hiatt Magnet School.
Ownership History
Date
Name
Owned For
Owner Type
Purchase Details
Closed on
May 20, 2022
Sold by
Hill Cynthia
Bought by
Kindregan Miriam J
Current Estimated Value
Home Financials for this Owner
Home Financials are based on the most recent Mortgage that was taken out on this home.
Original Mortgage
$290,945
Outstanding Balance
$273,738
Interest Rate
4.72%
Mortgage Type
Purchase Money Mortgage
Estimated Equity
$77,653
Purchase Details
Closed on
Apr 1, 2005
Sold by
Pellegrino Nancy L
Bought by
Hill Marlene B
Home Financials for this Owner
Home Financials are based on the most recent Mortgage that was taken out on this home.
Original Mortgage
$166,250
Interest Rate
5.61%
Mortgage Type
Purchase Money Mortgage
Create a Home Valuation Report for This Property
The Home Valuation Report is an in-depth analysis detailing your home's value as well as a comparison with similar homes in the area
Home Values in the Area
Average Home Value in this Area
Purchase History
| Date | Buyer | Sale Price | Title Company |
|---|---|---|---|
| Kindregan Miriam J | $310,000 | None Available | |
| Hill Marlene B | $175,000 | -- | |
| Hill Marlene B | $175,000 | -- |
Source: Public Records
Mortgage History
| Date | Status | Borrower | Loan Amount |
|---|---|---|---|
| Open | Kindregan Miriam J | $290,945 | |
| Previous Owner | Hill Marlene B | $166,250 | |
| Previous Owner | Hill Marlene B | $86,000 |
Source: Public Records
Tax History
| Year | Tax Paid | Tax Assessment Tax Assessment Total Assessment is a certain percentage of the fair market value that is determined by local assessors to be the total taxable value of land and additions on the property. | Land | Improvement |
|---|---|---|---|---|
| 2025 | $3,811 | $288,900 | $72,600 | $216,300 |
| 2024 | $3,616 | $263,000 | $72,600 | $190,400 |
| 2023 | $3,201 | $223,200 | $63,100 | $160,100 |
| 2022 | $2,929 | $192,600 | $50,500 | $142,100 |
| 2021 | $2,751 | $169,000 | $40,400 | $128,600 |
| 2020 | $2,684 | $157,900 | $40,100 | $117,800 |
| 2019 | $2,565 | $142,500 | $35,100 | $107,400 |
| 2018 | $2,568 | $135,800 | $35,100 | $100,700 |
| 2017 | $2,406 | $125,200 | $35,100 | $90,100 |
| 2016 | $2,345 | $113,800 | $25,700 | $88,100 |
| 2015 | $2,284 | $113,800 | $25,700 | $88,100 |
| 2014 | $2,224 | $113,800 | $25,700 | $88,100 |
Source: Public Records
Map
Nearby Homes
- 10 Minthorne St
- 114 Lovell St
- 9 Englewood Ave
- 152 Beaverbrook Pkwy
- 15 Circuit Ave E
- 78 Downing St
- 19 Oliver St
- 28 Walworth St
- 212 Dewey St
- 24 Geneva St
- 19 Woodbine St
- 33 Florence St
- 345 Park Ave
- 34 Rosslare Dr Unit 108
- 15 Longfellow Rd
- 10 Lucian St
- 33 Carlisle St
- 35 May St
- 4 Hartshorn Ave
- 5 Freeland Terrace
Your Personal Tour Guide
Ask me questions while you tour the home.