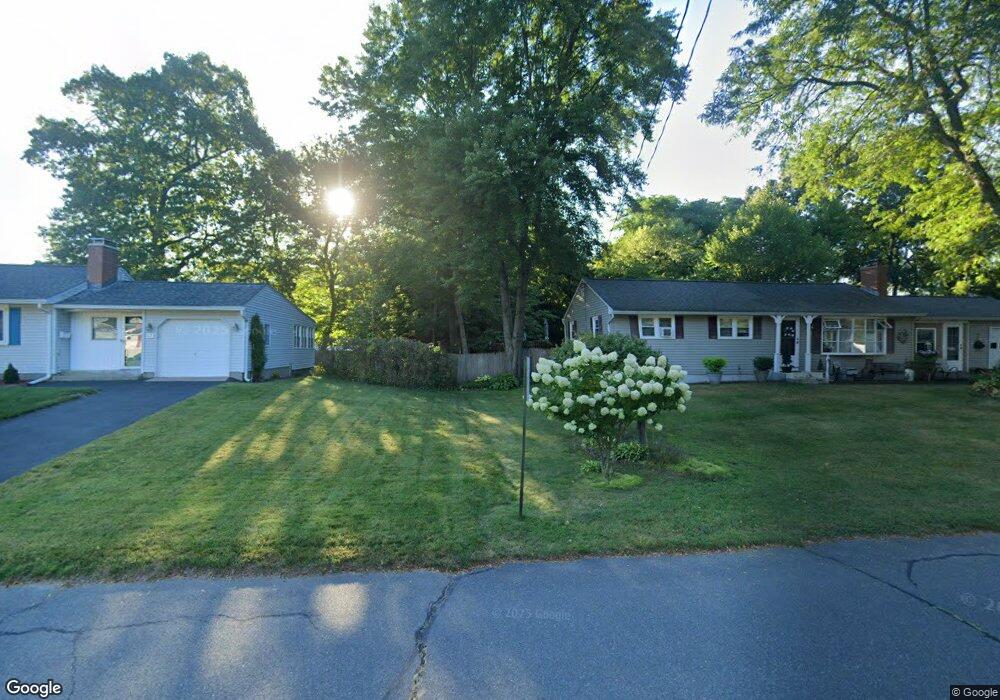
31 Carriage Dr Enfield, CT 06082
Estimated Value: $375,000 - $398,000
3
Beds
2
Baths
1,702
Sq Ft
$228/Sq Ft
Est. Value
About This Home
This home is located at 31 Carriage Dr, Enfield, CT 06082 and is currently estimated at $388,509, approximately $228 per square foot. 31 Carriage Dr is a home located in Hartford County with nearby schools including Eli Whitney Elementary School, Hazardville Memorial Elementary School, and John F. Kennedy Middle School.
Ownership History
Date
Name
Owned For
Owner Type
Purchase Details
Closed on
May 12, 1992
Sold by
Tarantino Irene
Bought by
Sidway Tod
Current Estimated Value
Home Financials for this Owner
Home Financials are based on the most recent Mortgage that was taken out on this home.
Original Mortgage
$124,900
Interest Rate
8.5%
Mortgage Type
Unknown
Create a Home Valuation Report for This Property
The Home Valuation Report is an in-depth analysis detailing your home's value as well as a comparison with similar homes in the area
Home Values in the Area
Average Home Value in this Area
Purchase History
| Date | Buyer | Sale Price | Title Company |
|---|---|---|---|
| Sidway Tod | $133,000 | -- |
Source: Public Records
Mortgage History
| Date | Status | Borrower | Loan Amount |
|---|---|---|---|
| Closed | Sidway Tod | $114,350 | |
| Closed | Sidway Tod | $15,000 | |
| Closed | Sidway Tod | $127,100 | |
| Closed | Sidway Tod | $124,900 |
Source: Public Records
Tax History Compared to Growth
Tax History
| Year | Tax Paid | Tax Assessment Tax Assessment Total Assessment is a certain percentage of the fair market value that is determined by local assessors to be the total taxable value of land and additions on the property. | Land | Improvement |
|---|---|---|---|---|
| 2025 | $6,953 | $198,700 | $62,500 | $136,200 |
| 2024 | $6,766 | $198,700 | $62,500 | $136,200 |
| 2023 | $6,716 | $198,700 | $62,500 | $136,200 |
| 2022 | $6,098 | $198,700 | $62,500 | $136,200 |
| 2021 | $5,780 | $154,020 | $51,730 | $102,290 |
| 2020 | $5,780 | $154,020 | $51,730 | $102,290 |
| 2019 | $5,796 | $154,020 | $51,730 | $102,290 |
| 2018 | $5,699 | $154,020 | $51,730 | $102,290 |
| 2017 | $5,380 | $154,020 | $51,730 | $102,290 |
| 2016 | $5,259 | $153,290 | $53,080 | $100,210 |
| 2015 | $5,095 | $153,290 | $53,080 | $100,210 |
| 2014 | $4,964 | $153,290 | $53,080 | $100,210 |
Source: Public Records
Map
Nearby Homes