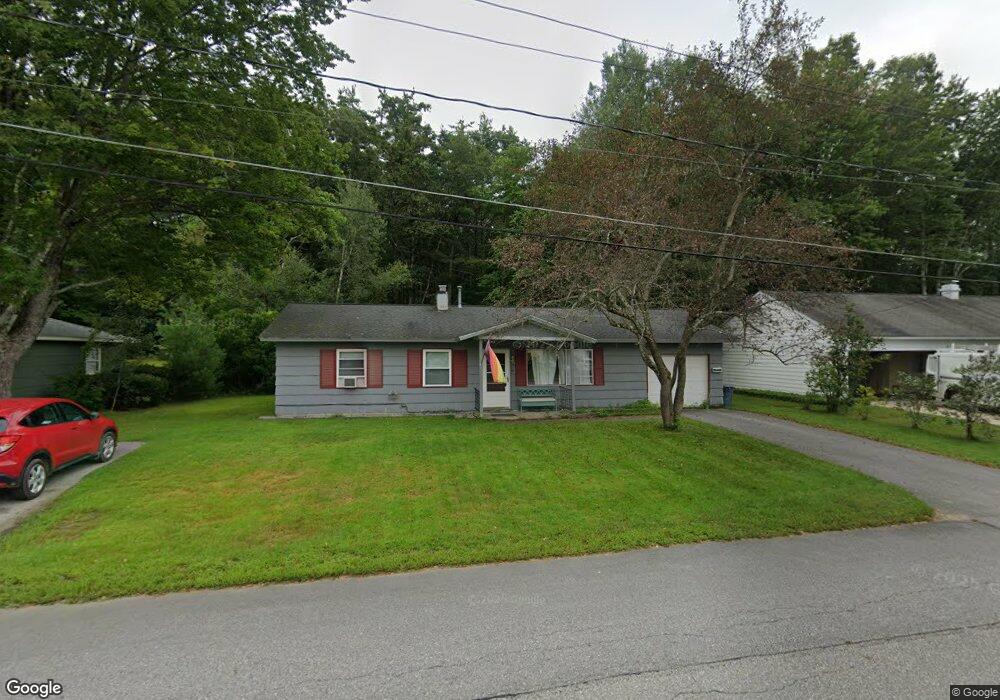
31 Conant Dr Concord, NH 03301
South End NeighborhoodEstimated Value: $402,640 - $494,000
3
Beds
1
Bath
1,225
Sq Ft
$366/Sq Ft
Est. Value
About This Home
This home is located at 31 Conant Dr, Concord, NH 03301 and is currently estimated at $448,160, approximately $365 per square foot. 31 Conant Dr is a home located in Merrimack County with nearby schools including Abbot-Downing School, Rundlett Middle School, and Concord High School.
Ownership History
Date
Name
Owned For
Owner Type
Purchase Details
Closed on
Dec 8, 2023
Sold by
Mamos Christopher T
Bought by
Mamos Ft and Mamos
Current Estimated Value
Purchase Details
Closed on
Oct 23, 1998
Sold by
Landrigan Robert J
Bought by
Mamos Christopher T
Home Financials for this Owner
Home Financials are based on the most recent Mortgage that was taken out on this home.
Original Mortgage
$88,980
Interest Rate
6.74%
Mortgage Type
Purchase Money Mortgage
Create a Home Valuation Report for This Property
The Home Valuation Report is an in-depth analysis detailing your home's value as well as a comparison with similar homes in the area
Home Values in the Area
Average Home Value in this Area
Purchase History
| Date | Buyer | Sale Price | Title Company |
|---|---|---|---|
| Mamos Ft | -- | None Available | |
| Mamos Christopher T | $89,900 | -- | |
| Mamos Christopher T | $89,900 | -- |
Source: Public Records
Mortgage History
| Date | Status | Borrower | Loan Amount |
|---|---|---|---|
| Previous Owner | Mamos Christopher T | $100,000 | |
| Previous Owner | Mamos Christopher T | $88,980 |
Source: Public Records
Tax History Compared to Growth
Tax History
| Year | Tax Paid | Tax Assessment Tax Assessment Total Assessment is a certain percentage of the fair market value that is determined by local assessors to be the total taxable value of land and additions on the property. | Land | Improvement |
|---|---|---|---|---|
| 2024 | $7,324 | $264,500 | $110,100 | $154,400 |
| 2023 | $7,104 | $264,500 | $110,100 | $154,400 |
| 2022 | $6,848 | $264,500 | $110,100 | $154,400 |
| 2021 | $6,632 | $264,000 | $110,400 | $153,600 |
| 2020 | $6,002 | $224,300 | $88,100 | $136,200 |
| 2019 | $5,645 | $203,200 | $86,500 | $116,700 |
| 2018 | $5,458 | $193,600 | $86,500 | $107,100 |
| 2017 | $5,264 | $186,400 | $86,500 | $99,900 |
| 2016 | $4,970 | $179,600 | $84,900 | $94,700 |
| 2015 | $4,727 | $168,100 | $88,600 | $79,500 |
| 2014 | $4,507 | $168,100 | $88,600 | $79,500 |
| 2013 | -- | $165,900 | $88,600 | $77,300 |
| 2012 | -- | $160,600 | $88,600 | $72,000 |
Source: Public Records
Map
Nearby Homes
- 0 South St Unit 4969509
- 5 Broad Ave
- 1 Matthew St Unit 6
- 105 S Main St
- 0 Spruce St Unit 88
- 33 Spruce St
- 24 Pierce St
- 47 South St
- 1 Kensington Rd
- 26 South St
- 4 N Spring St
- 69 Centre St
- 24 Hazel Dr
- 22 Longmeadow Dr
- 128 Liberty St
- 55 Tremont St
- 30 Jackson St
- 11 Washington St
- 7 Highridge Trail
- 30 Albin Rd