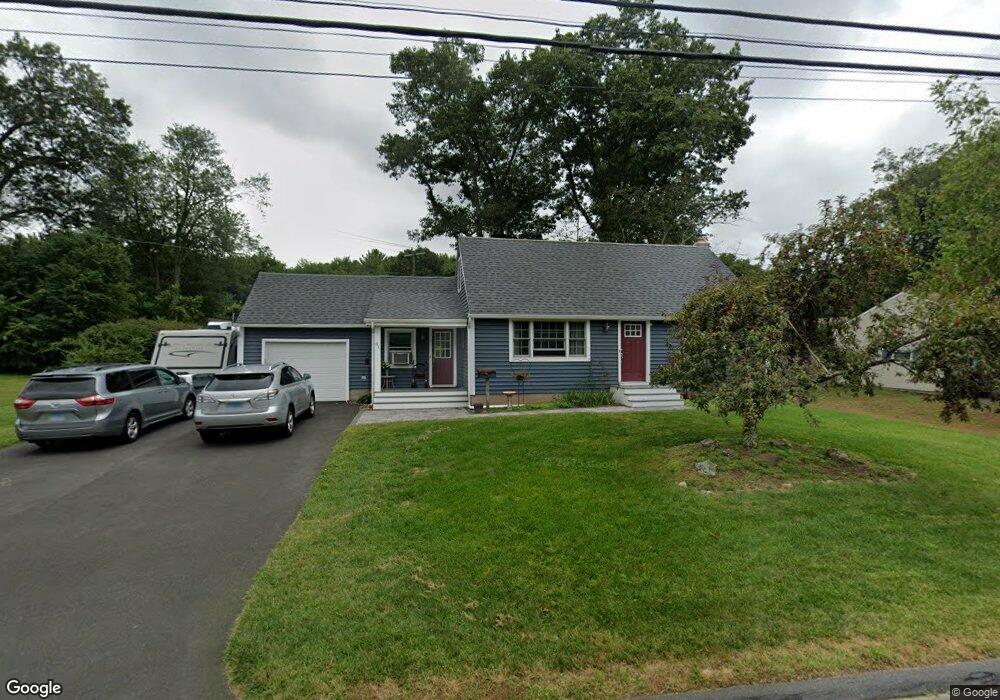
31 David St Enfield, CT 06082
Estimated Value: $322,000 - $337,000
4
Beds
2
Baths
1,389
Sq Ft
$236/Sq Ft
Est. Value
About This Home
This home is located at 31 David St, Enfield, CT 06082 and is currently estimated at $327,854, approximately $236 per square foot. 31 David St is a home located in Hartford County with nearby schools including Eli Whitney Elementary School, Hazardville Memorial Elementary School, and Enfield High School.
Ownership History
Date
Name
Owned For
Owner Type
Purchase Details
Closed on
Aug 29, 2003
Sold by
Beaucage Ronald and Beaucage Rebecca
Bought by
Carllo Theresa and Carllo Frank
Current Estimated Value
Home Financials for this Owner
Home Financials are based on the most recent Mortgage that was taken out on this home.
Original Mortgage
$139,900
Interest Rate
5.69%
Purchase Details
Closed on
Sep 30, 1992
Sold by
Rudek Ronald and Rudek Nancy
Bought by
Beaucage Ronald and Beaucage Rebecca
Create a Home Valuation Report for This Property
The Home Valuation Report is an in-depth analysis detailing your home's value as well as a comparison with similar homes in the area
Home Values in the Area
Average Home Value in this Area
Purchase History
| Date | Buyer | Sale Price | Title Company |
|---|---|---|---|
| Carllo Theresa | $174,900 | -- | |
| Beaucage Ronald | $125,000 | -- |
Source: Public Records
Mortgage History
| Date | Status | Borrower | Loan Amount |
|---|---|---|---|
| Closed | Beaucage Ronald | $107,500 | |
| Closed | Beaucage Ronald | $120,000 | |
| Closed | Beaucage Ronald | $137,300 | |
| Closed | Beaucage Ronald | $139,900 |
Source: Public Records
Tax History
| Year | Tax Paid | Tax Assessment Tax Assessment Total Assessment is a certain percentage of the fair market value that is determined by local assessors to be the total taxable value of land and additions on the property. | Land | Improvement |
|---|---|---|---|---|
| 2025 | $5,395 | $154,200 | $56,600 | $97,600 |
| 2024 | $5,251 | $154,200 | $56,600 | $97,600 |
| 2023 | $4,989 | $147,600 | $56,600 | $91,000 |
| 2022 | $4,521 | $147,300 | $56,600 | $90,700 |
| 2021 | $4,407 | $117,430 | $46,890 | $70,540 |
| 2020 | $4,407 | $117,430 | $46,890 | $70,540 |
| 2019 | $4,419 | $117,430 | $46,890 | $70,540 |
| 2018 | $4,345 | $117,430 | $46,890 | $70,540 |
| 2017 | $4,102 | $117,430 | $46,890 | $70,540 |
| 2016 | $4,011 | $116,900 | $48,110 | $68,790 |
| 2015 | $3,886 | $116,900 | $48,110 | $68,790 |
| 2014 | $3,785 | $116,900 | $48,110 | $68,790 |
Source: Public Records
Map
Nearby Homes
Your Personal Tour Guide
Ask me questions while you tour the home.