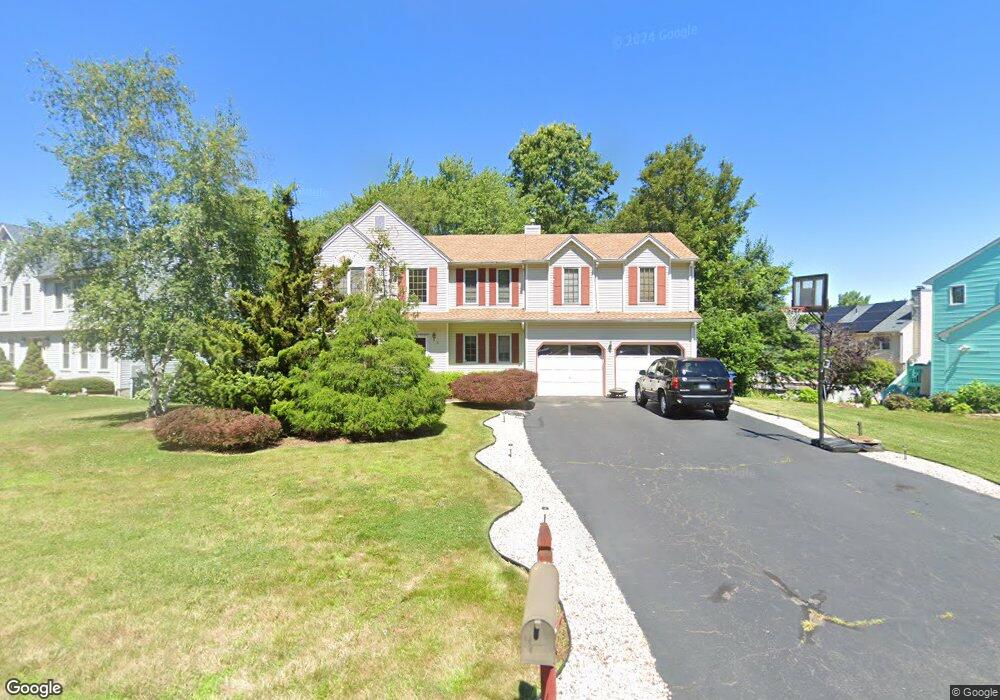
31 Joshua Hill Windsor, CT 06095
Estimated Value: $431,000 - $469,000
3
Beds
3
Baths
1,874
Sq Ft
$237/Sq Ft
Est. Value
About This Home
This home is located at 31 Joshua Hill, Windsor, CT 06095 and is currently estimated at $444,036, approximately $236 per square foot. 31 Joshua Hill is a home located in Hartford County with nearby schools including Oliver Ellsworth School, John F. Kennedy School, and Sage Park Middle School.
Ownership History
Date
Name
Owned For
Owner Type
Purchase Details
Closed on
Oct 31, 2002
Sold by
Aaron Robert and Aaron Laurie
Bought by
Walsh Milton and Marin Marilyn
Current Estimated Value
Home Financials for this Owner
Home Financials are based on the most recent Mortgage that was taken out on this home.
Original Mortgage
$241,300
Interest Rate
8.2%
Mortgage Type
Purchase Money Mortgage
Purchase Details
Closed on
Feb 1, 1995
Sold by
Manderville Arnold
Bought by
Aaron Robert and Aaron Laurie
Purchase Details
Closed on
Jul 3, 1991
Sold by
T & M Bldg Co
Bought by
Manderville Arnold
Create a Home Valuation Report for This Property
The Home Valuation Report is an in-depth analysis detailing your home's value as well as a comparison with similar homes in the area
Home Values in the Area
Average Home Value in this Area
Purchase History
| Date | Buyer | Sale Price | Title Company |
|---|---|---|---|
| Walsh Milton | $254,000 | -- | |
| Aaron Robert | $167,000 | -- | |
| Manderville Arnold | $168,000 | -- |
Source: Public Records
Mortgage History
| Date | Status | Borrower | Loan Amount |
|---|---|---|---|
| Open | Manderville Arnold | $215,864 | |
| Closed | Manderville Arnold | $240,000 | |
| Closed | Manderville Arnold | $241,300 | |
| Previous Owner | Manderville Arnold | $153,000 |
Source: Public Records
Tax History Compared to Growth
Tax History
| Year | Tax Paid | Tax Assessment Tax Assessment Total Assessment is a certain percentage of the fair market value that is determined by local assessors to be the total taxable value of land and additions on the property. | Land | Improvement |
|---|---|---|---|---|
| 2025 | $7,199 | $253,050 | $61,390 | $191,660 |
| 2024 | $7,672 | $253,050 | $61,390 | $191,660 |
| 2023 | $5,678 | $168,980 | $48,160 | $120,820 |
| 2022 | $5,622 | $168,980 | $48,160 | $120,820 |
| 2021 | $5,622 | $168,980 | $48,160 | $120,820 |
| 2020 | $5,595 | $168,980 | $48,160 | $120,820 |
| 2019 | $5,472 | $168,980 | $48,160 | $120,820 |
| 2018 | $5,318 | $161,350 | $48,160 | $113,190 |
| 2017 | $5,236 | $161,350 | $48,160 | $113,190 |
| 2016 | $5,086 | $161,350 | $48,160 | $113,190 |
| 2015 | $4,989 | $161,350 | $48,160 | $113,190 |
| 2014 | $4,916 | $161,350 | $48,160 | $113,190 |
Source: Public Records
Map
Nearby Homes