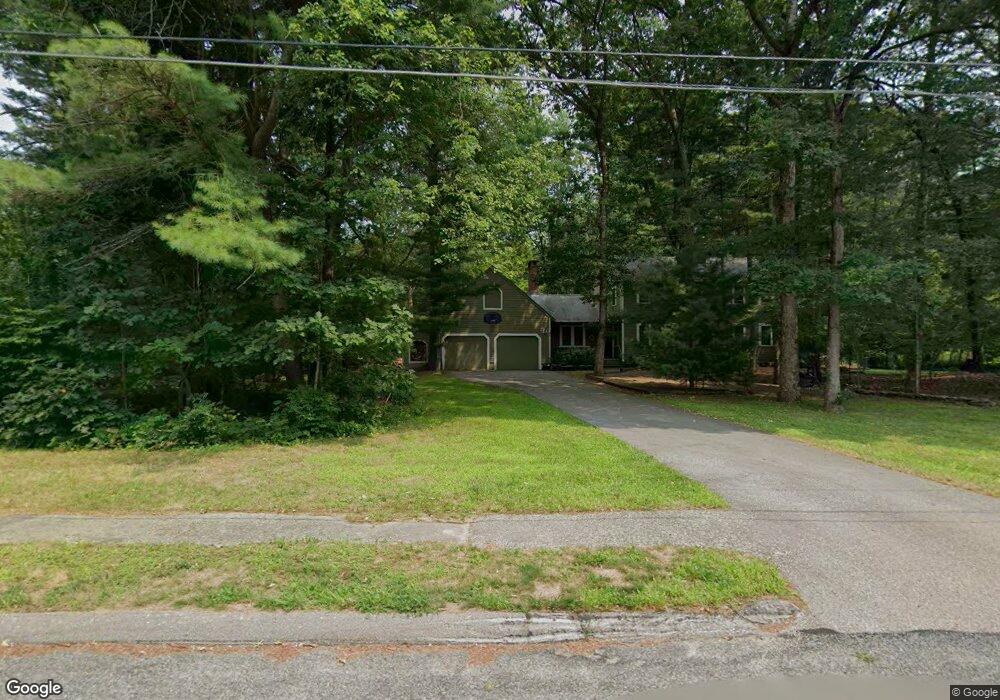
31 Lantern Ln Mansfield, MA 02048
Estimated Value: $720,000 - $840,000
3
Beds
2
Baths
2,016
Sq Ft
$392/Sq Ft
Est. Value
About This Home
This home is located at 31 Lantern Ln, Mansfield, MA 02048 and is currently estimated at $790,908, approximately $392 per square foot. 31 Lantern Ln is a home located in Bristol County with nearby schools including Everett W. Robinson Elementary School, Jordan/Jackson Elementary School, and Harold L. Qualters Middle School.
Ownership History
Date
Name
Owned For
Owner Type
Purchase Details
Closed on
Jul 6, 2015
Sold by
Fassak Diane H and Fassak John A
Bought by
John & Diane Fassak Ft
Current Estimated Value
Purchase Details
Closed on
Apr 25, 1995
Sold by
Stephens Robert L and Stephens Karen S
Bought by
Huston-Fassak Diane and Fassak John A
Home Financials for this Owner
Home Financials are based on the most recent Mortgage that was taken out on this home.
Original Mortgage
$162,250
Interest Rate
8.55%
Mortgage Type
Purchase Money Mortgage
Create a Home Valuation Report for This Property
The Home Valuation Report is an in-depth analysis detailing your home's value as well as a comparison with similar homes in the area
Home Values in the Area
Average Home Value in this Area
Purchase History
| Date | Buyer | Sale Price | Title Company |
|---|---|---|---|
| John & Diane Fassak Ft | -- | -- | |
| Huston-Fassak Diane | $206,600 | -- |
Source: Public Records
Mortgage History
| Date | Status | Borrower | Loan Amount |
|---|---|---|---|
| Previous Owner | Huston-Fassak Diane | $161,000 | |
| Previous Owner | Huston-Fassak Diane | $162,250 |
Source: Public Records
Tax History
| Year | Tax Paid | Tax Assessment Tax Assessment Total Assessment is a certain percentage of the fair market value that is determined by local assessors to be the total taxable value of land and additions on the property. | Land | Improvement |
|---|---|---|---|---|
| 2025 | $9,636 | $731,700 | $324,200 | $407,500 |
| 2024 | $9,351 | $692,700 | $336,900 | $355,800 |
| 2023 | $9,123 | $647,500 | $336,900 | $310,600 |
| 2022 | $8,827 | $581,900 | $314,400 | $267,500 |
| 2021 | $8,328 | $542,200 | $261,400 | $280,800 |
| 2020 | $8,213 | $534,700 | $261,400 | $273,300 |
| 2019 | $7,580 | $498,000 | $222,200 | $275,800 |
| 2018 | $3,200 | $484,100 | $213,300 | $270,800 |
| 2017 | $7,080 | $471,400 | $208,100 | $263,300 |
| 2016 | $6,599 | $428,200 | $199,200 | $229,000 |
| 2015 | -- | $416,500 | $199,200 | $217,300 |
Source: Public Records
Map
Nearby Homes
- 2 Oak St Unit 2B
- 14 Claire Ave
- 451R Gilbert St
- 250 Mansfield Ave Unit 11
- 150 Gilbert St
- 343 Godfrey Dr
- 143 Oak St Unit 10
- 71 Richardson Ave
- 157 Mansfield Ave Unit 27
- 157 Mansfield Ave Unit 14
- 10 Walter St
- 128 Tremont St
- 49 Pheasant Hill Rd
- 19 Barberry Rd
- 16 Holly Rd
- 20 John F. Kennedy Dr
- 4 Village Way Unit F
- 345 Richardson Ave
- 21 Juniper Rd
- 24 Maverick Dr
Your Personal Tour Guide
Ask me questions while you tour the home.