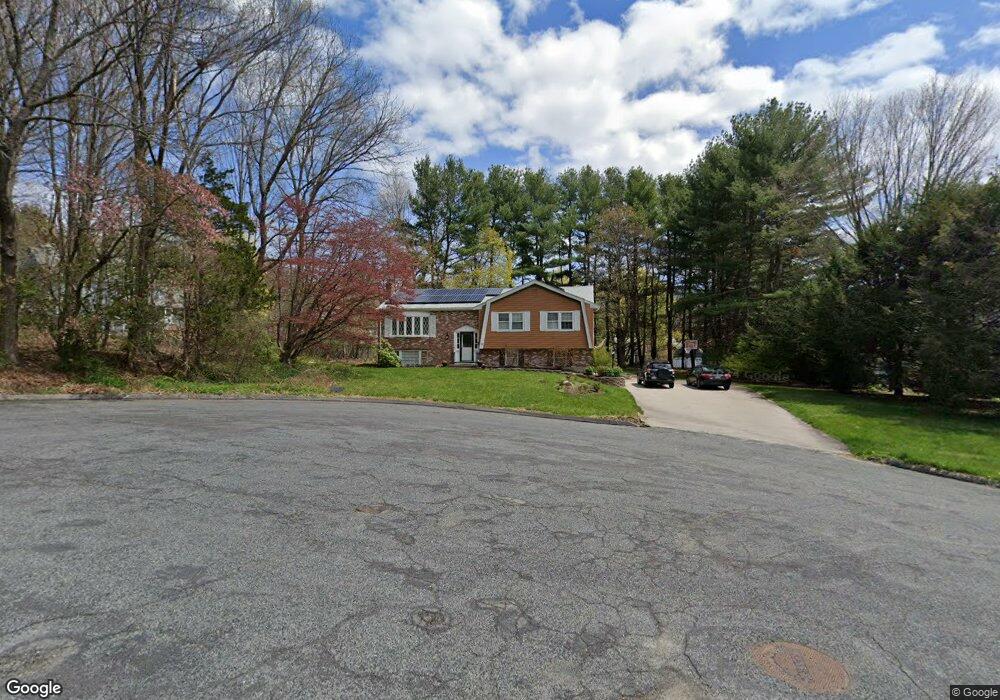
31 Larnis Rd Framingham, MA 01701
Saxonville NeighborhoodEstimated Value: $701,000 - $731,000
3
Beds
3
Baths
1,924
Sq Ft
$375/Sq Ft
Est. Value
About This Home
This home is located at 31 Larnis Rd, Framingham, MA 01701 and is currently estimated at $722,158, approximately $375 per square foot. 31 Larnis Rd is a home located in Middlesex County with nearby schools including Framingham High School and MetroWest Jewish Day School.
Ownership History
Date
Name
Owned For
Owner Type
Purchase Details
Closed on
Mar 20, 2008
Sold by
Brownlee Carroll R
Bought by
Lee Daniel J and Alleva Stacey S
Current Estimated Value
Home Financials for this Owner
Home Financials are based on the most recent Mortgage that was taken out on this home.
Original Mortgage
$292,800
Outstanding Balance
$182,508
Interest Rate
5.75%
Mortgage Type
Purchase Money Mortgage
Estimated Equity
$539,650
Purchase Details
Closed on
Oct 2, 1998
Sold by
Weiner Roberta Est and Weiner
Bought by
Brownlee Carroll R
Home Financials for this Owner
Home Financials are based on the most recent Mortgage that was taken out on this home.
Original Mortgage
$185,600
Interest Rate
6.89%
Mortgage Type
Purchase Money Mortgage
Create a Home Valuation Report for This Property
The Home Valuation Report is an in-depth analysis detailing your home's value as well as a comparison with similar homes in the area
Home Values in the Area
Average Home Value in this Area
Purchase History
| Date | Buyer | Sale Price | Title Company |
|---|---|---|---|
| Lee Daniel J | $366,000 | -- | |
| Lee Daniel J | $366,000 | -- | |
| Brownlee Carroll R | $232,000 | -- |
Source: Public Records
Mortgage History
| Date | Status | Borrower | Loan Amount |
|---|---|---|---|
| Open | Lee Daniel J | $292,800 | |
| Closed | Brownlee Carroll R | $292,800 | |
| Previous Owner | Brownlee Carroll R | $185,600 |
Source: Public Records
Tax History
| Year | Tax Paid | Tax Assessment Tax Assessment Total Assessment is a certain percentage of the fair market value that is determined by local assessors to be the total taxable value of land and additions on the property. | Land | Improvement |
|---|---|---|---|---|
| 2025 | $8,022 | $671,900 | $272,800 | $399,100 |
| 2024 | $7,535 | $604,700 | $243,700 | $361,000 |
| 2023 | $7,112 | $543,300 | $217,500 | $325,800 |
| 2022 | $6,741 | $490,600 | $197,400 | $293,200 |
| 2021 | $6,654 | $473,600 | $189,700 | $283,900 |
| 2020 | $6,722 | $448,700 | $172,400 | $276,300 |
| 2019 | $6,696 | $435,400 | $172,400 | $263,000 |
| 2018 | $6,631 | $406,300 | $166,000 | $240,300 |
| 2017 | $6,407 | $383,400 | $161,100 | $222,300 |
| 2016 | $6,262 | $360,300 | $161,100 | $199,200 |
| 2015 | $6,299 | $353,500 | $161,400 | $192,100 |
Source: Public Records
Map
Nearby Homes
Your Personal Tour Guide
Ask me questions while you tour the home.