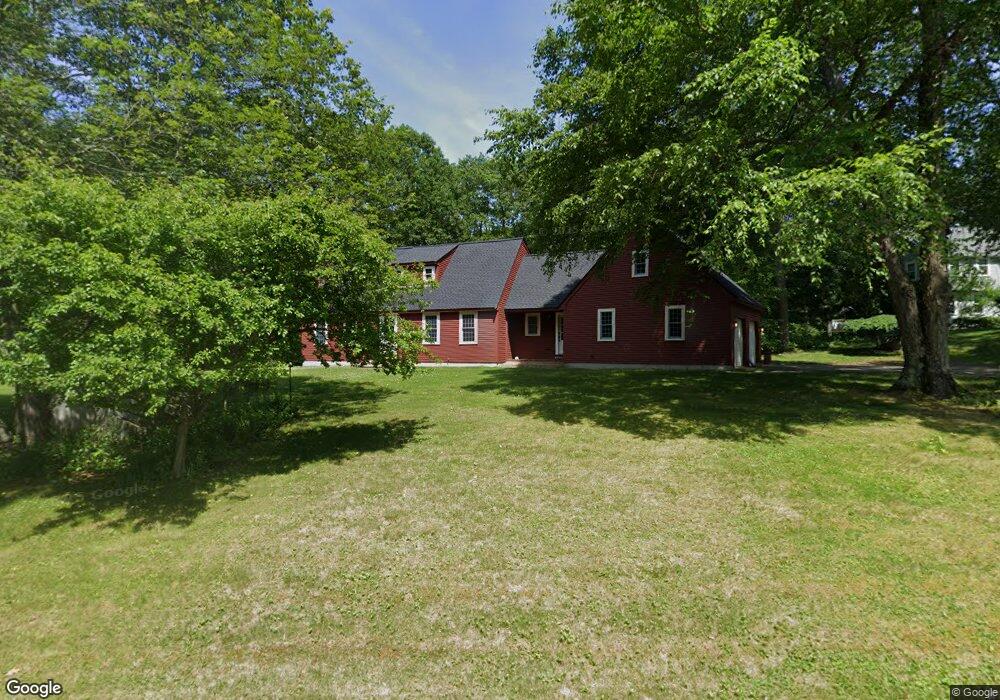
31 Old Kings Rd Merrimack, NH 03054
Estimated Value: $637,932 - $777,000
3
Beds
2
Baths
3,078
Sq Ft
$226/Sq Ft
Est. Value
About This Home
This home is located at 31 Old Kings Rd, Merrimack, NH 03054 and is currently estimated at $695,733, approximately $226 per square foot. 31 Old Kings Rd is a home located in Hillsborough County with nearby schools including Thorntons Ferry School, Merrimack Middle School, and James Mastricola Upper Elementary School.
Ownership History
Date
Name
Owned For
Owner Type
Purchase Details
Closed on
Jun 29, 2018
Sold by
Elizabeth A Levasseur
Bought by
Hickey John
Current Estimated Value
Home Financials for this Owner
Home Financials are based on the most recent Mortgage that was taken out on this home.
Original Mortgage
$120,000
Outstanding Balance
$104,113
Interest Rate
4.55%
Estimated Equity
$591,620
Purchase Details
Closed on
May 13, 2002
Sold by
Brown Douglas C and Brown Claudia C
Bought by
Hickey John T
Home Financials for this Owner
Home Financials are based on the most recent Mortgage that was taken out on this home.
Original Mortgage
$231,920
Interest Rate
7.18%
Purchase Details
Closed on
Oct 1, 2001
Sold by
Brown Benton C and Brown Sheila M
Bought by
Brown Douglas C and Brown Claudia C
Home Financials for this Owner
Home Financials are based on the most recent Mortgage that was taken out on this home.
Original Mortgage
$207,100
Interest Rate
6.91%
Create a Home Valuation Report for This Property
The Home Valuation Report is an in-depth analysis detailing your home's value as well as a comparison with similar homes in the area
Home Values in the Area
Average Home Value in this Area
Purchase History
| Date | Buyer | Sale Price | Title Company |
|---|---|---|---|
| Hickey John | -- | -- | |
| Hickey John T | $289,900 | -- | |
| Brown Douglas C | $258,900 | -- |
Source: Public Records
Mortgage History
| Date | Status | Borrower | Loan Amount |
|---|---|---|---|
| Open | Brown Douglas C | $120,000 | |
| Closed | Brown Douglas C | -- | |
| Previous Owner | Brown Douglas C | $231,920 | |
| Previous Owner | Brown Douglas C | $207,100 |
Source: Public Records
Tax History Compared to Growth
Tax History
| Year | Tax Paid | Tax Assessment Tax Assessment Total Assessment is a certain percentage of the fair market value that is determined by local assessors to be the total taxable value of land and additions on the property. | Land | Improvement |
|---|---|---|---|---|
| 2024 | $9,815 | $474,400 | $229,100 | $245,300 |
| 2023 | $9,227 | $474,400 | $229,100 | $245,300 |
| 2022 | $8,245 | $474,400 | $229,100 | $245,300 |
| 2021 | $8,066 | $469,800 | $229,100 | $240,700 |
| 2020 | $8,226 | $341,900 | $160,700 | $181,200 |
| 2019 | $8,250 | $341,900 | $160,700 | $181,200 |
| 2018 | $8,247 | $341,900 | $160,700 | $181,200 |
| 2017 | $7,990 | $341,900 | $160,700 | $181,200 |
| 2016 | $7,792 | $341,900 | $160,700 | $181,200 |
| 2015 | $7,745 | $313,300 | $144,100 | $169,200 |
| 2014 | $7,547 | $313,300 | $144,100 | $169,200 |
| 2013 | $7,491 | $313,300 | $144,100 | $169,200 |
Source: Public Records
Map
Nearby Homes
- 11 Queens Way
- 15 Four Winds Rd
- 80 Peaslee Rd
- 9 Cambridge Dr
- 6 Mason Rd
- 103 Seaverns Bridge Rd
- 105 Seaverns Bridge Rd
- 101-2 Seaverns Bridge Rd
- 1 County Rd
- 27 Sarah Dr
- 66 Tinker Rd
- 1 Longwood Ln
- 3 Roedean Dr Unit C-207
- 218 Millwright Dr Unit 218
- 201 Millwright Dr
- 14 Turnbuckle Ln Unit 38
- 40 Turkey Hill Rd
- 5 Lynn Dr
- 77 E Ridge Rd
- 5 Jennifer Dr Unit B