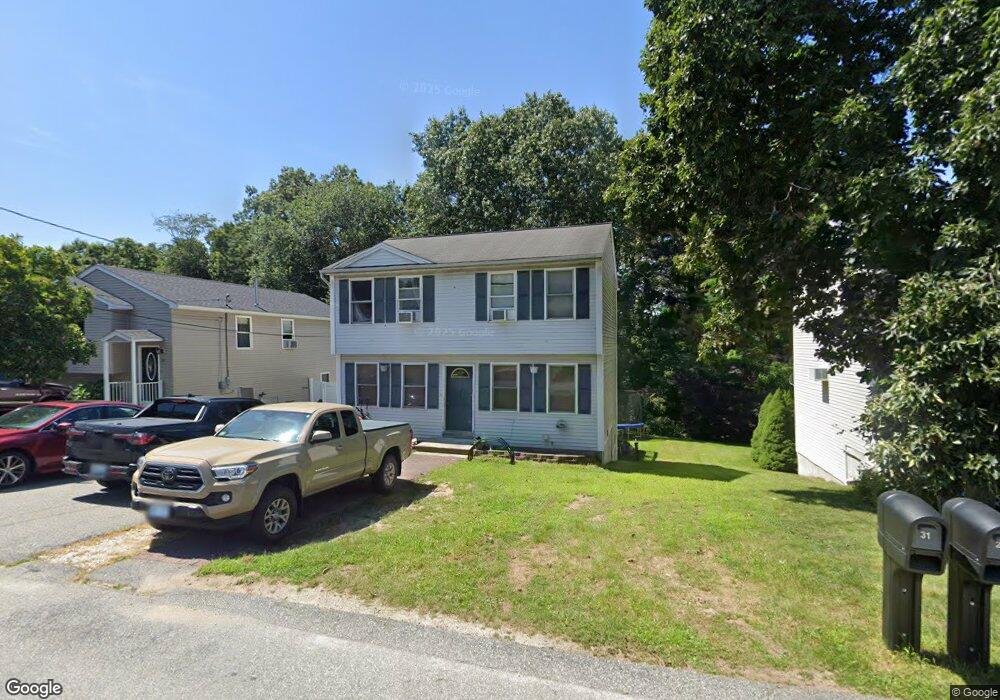
31 Poisson St Cumberland, RI 02864
Cumberland Hill NeighborhoodEstimated Value: $457,000 - $546,000
3
Beds
2
Baths
1,200
Sq Ft
$420/Sq Ft
Est. Value
About This Home
This home is located at 31 Poisson St, Cumberland, RI 02864 and is currently estimated at $503,618, approximately $419 per square foot. 31 Poisson St is a home located in Providence County with nearby schools including John J. McLaughlin Cumberland Hill School, North Cumberland Middle School, and Cumberland High School.
Ownership History
Date
Name
Owned For
Owner Type
Purchase Details
Closed on
Jun 15, 1998
Sold by
Lamson Riley E
Bought by
Vagnini Raymond Lc and Vagnini Cindy
Current Estimated Value
Home Financials for this Owner
Home Financials are based on the most recent Mortgage that was taken out on this home.
Original Mortgage
$119,561
Interest Rate
7.11%
Create a Home Valuation Report for This Property
The Home Valuation Report is an in-depth analysis detailing your home's value as well as a comparison with similar homes in the area
Home Values in the Area
Average Home Value in this Area
Purchase History
| Date | Buyer | Sale Price | Title Company |
|---|---|---|---|
| Vagnini Raymond Lc | $120,000 | -- |
Source: Public Records
Mortgage History
| Date | Status | Borrower | Loan Amount |
|---|---|---|---|
| Open | Vagnini Raymond Lc | $192,295 | |
| Closed | Vagnini Raymond Lc | $180,000 | |
| Closed | Vagnini Raymond Lc | $156,702 | |
| Closed | Vagnini Raymond Lc | $119,561 |
Source: Public Records
Tax History Compared to Growth
Tax History
| Year | Tax Paid | Tax Assessment Tax Assessment Total Assessment is a certain percentage of the fair market value that is determined by local assessors to be the total taxable value of land and additions on the property. | Land | Improvement |
|---|---|---|---|---|
| 2025 | $4,441 | $361,900 | $133,900 | $228,000 |
| 2024 | $4,325 | $361,900 | $133,900 | $228,000 |
| 2023 | $4,205 | $361,900 | $133,900 | $228,000 |
| 2022 | $3,933 | $262,400 | $93,600 | $168,800 |
| 2021 | $3,868 | $262,400 | $93,600 | $168,800 |
| 2020 | $3,758 | $262,400 | $93,600 | $168,800 |
| 2019 | $3,656 | $230,200 | $78,200 | $152,000 |
| 2018 | $3,550 | $230,200 | $78,200 | $152,000 |
| 2017 | $3,501 | $230,200 | $78,200 | $152,000 |
| 2016 | $3,505 | $205,200 | $73,700 | $131,500 |
| 2015 | $3,505 | $205,200 | $73,700 | $131,500 |
| 2014 | $3,505 | $205,200 | $73,700 | $131,500 |
| 2013 | $3,494 | $221,400 | $76,600 | $144,800 |
Source: Public Records
Map
Nearby Homes
- 0 Acorn St
- 5 Edgewood Ave
- 19 Marques St
- 3 Quail St
- 49 Branch Ave
- 45 Valley View Dr
- 3889 Mendon Rd
- 13 Plant St
- 252 Railroad St
- 39 Vivian St
- 40 Warren Ave
- 64 Aborn Ave
- 28 Alton Ave
- 253 Central St
- 25 Manville Hill Rd
- 39 Louise St
- 41 Mount Pleasant View Ave
- 200 Manville Hill Rd Unit 64
- 2 Angle St Unit 5
- 200 Heroux Blvd Unit 606