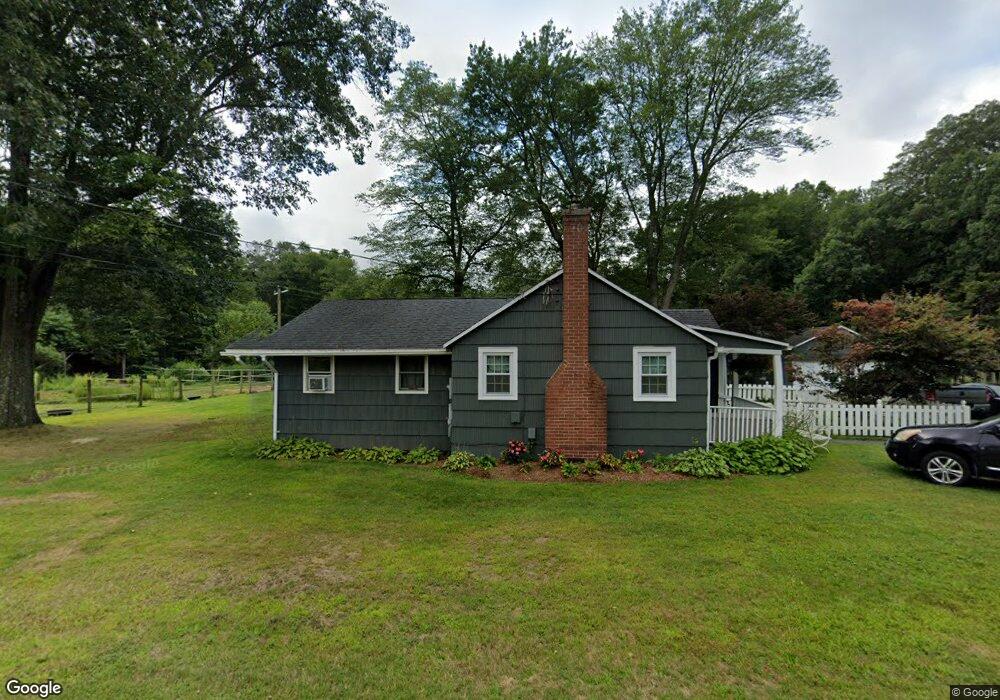
31 Post Rd Enfield, CT 06082
Estimated Value: $345,000 - $515,000
3
Beds
1
Bath
1,434
Sq Ft
$284/Sq Ft
Est. Value
About This Home
This home is located at 31 Post Rd, Enfield, CT 06082 and is currently estimated at $407,180, approximately $283 per square foot. 31 Post Rd is a home located in Hartford County with nearby schools including Eli Whitney Elementary School, Hazardville Memorial Elementary School, and John F. Kennedy Middle School.
Ownership History
Date
Name
Owned For
Owner Type
Purchase Details
Closed on
Feb 2, 2022
Sold by
Green Rebecca E
Bought by
Allen Daniel J and Green Rebecca E
Current Estimated Value
Home Financials for this Owner
Home Financials are based on the most recent Mortgage that was taken out on this home.
Original Mortgage
$185,000
Outstanding Balance
$171,577
Interest Rate
3.45%
Mortgage Type
Stand Alone Refi Refinance Of Original Loan
Estimated Equity
$235,603
Purchase Details
Closed on
Jan 3, 2012
Sold by
Green Daniel N
Bought by
Green Rebecca E
Purchase Details
Closed on
Jul 11, 2006
Sold by
Allen Steophe and Allen Tracy
Bought by
Green Daniel and Green Rebeeca
Purchase Details
Closed on
Nov 16, 2001
Sold by
Gelinas Robert and Dubois Carolyn
Bought by
Allen Stephen and Allen Tracy
Create a Home Valuation Report for This Property
The Home Valuation Report is an in-depth analysis detailing your home's value as well as a comparison with similar homes in the area
Home Values in the Area
Average Home Value in this Area
Purchase History
| Date | Buyer | Sale Price | Title Company |
|---|---|---|---|
| Allen Daniel J | -- | None Available | |
| Allen Daniel J | -- | None Available | |
| Green Rebecca E | -- | -- | |
| Green Rebecca E | -- | -- | |
| Green Daniel | $249,000 | -- | |
| Green Daniel | $249,000 | -- | |
| Allen Stephen | $155,000 | -- | |
| Allen Stephen | $155,000 | -- |
Source: Public Records
Mortgage History
| Date | Status | Borrower | Loan Amount |
|---|---|---|---|
| Open | Allen Daniel J | $185,000 | |
| Previous Owner | Allen Stephen | $184,800 | |
| Previous Owner | Allen Stephen | $15,000 |
Source: Public Records
Tax History Compared to Growth
Tax History
| Year | Tax Paid | Tax Assessment Tax Assessment Total Assessment is a certain percentage of the fair market value that is determined by local assessors to be the total taxable value of land and additions on the property. | Land | Improvement |
|---|---|---|---|---|
| 2025 | $7,220 | $206,350 | $86,550 | $119,800 |
| 2024 | $7,026 | $206,350 | $86,550 | $119,800 |
| 2023 | $7,462 | $220,760 | $100,960 | $119,800 |
| 2022 | $6,775 | $220,760 | $100,960 | $119,800 |
| 2021 | $7,598 | $202,440 | $104,440 | $98,000 |
| 2020 | $7,598 | $202,440 | $104,440 | $98,000 |
| 2019 | $7,618 | $202,440 | $104,440 | $98,000 |
| 2018 | $7,490 | $202,440 | $104,440 | $98,000 |
| 2017 | $7,071 | $202,440 | $104,440 | $98,000 |
| 2016 | $7,286 | $212,350 | $106,770 | $105,580 |
| 2015 | $4,009 | $205,920 | $106,770 | $99,150 |
| 2014 | $6,668 | $205,920 | $106,770 | $99,150 |
Source: Public Records
Map
Nearby Homes