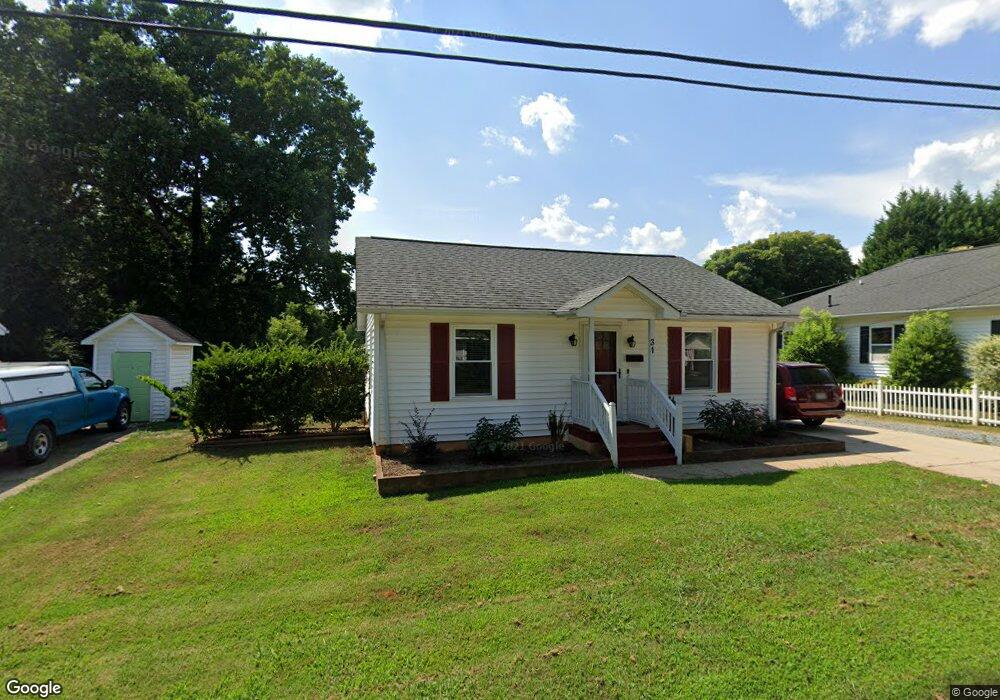
31 S 10th St Belmont, NC 28012
Estimated Value: $231,000 - $254,000
2
Beds
1
Bath
844
Sq Ft
$292/Sq Ft
Est. Value
About This Home
This home is located at 31 S 10th St, Belmont, NC 28012 and is currently estimated at $246,771, approximately $292 per square foot. 31 S 10th St is a home located in Gaston County with nearby schools including J B Page Elementary School, Belmont Central Elementary School, and Belmont Middle School.
Ownership History
Date
Name
Owned For
Owner Type
Purchase Details
Closed on
Nov 19, 2010
Sold by
Smart Alison P and Smart James
Bought by
Smart Alison P and Smart James R
Current Estimated Value
Home Financials for this Owner
Home Financials are based on the most recent Mortgage that was taken out on this home.
Original Mortgage
$82,050
Outstanding Balance
$55,444
Interest Rate
4.75%
Mortgage Type
FHA
Estimated Equity
$191,327
Purchase Details
Closed on
Feb 6, 2003
Sold by
Southers Kevin and Southers Cheri
Bought by
Flynn Alison P
Home Financials for this Owner
Home Financials are based on the most recent Mortgage that was taken out on this home.
Original Mortgage
$71,500
Interest Rate
5.95%
Purchase Details
Closed on
Feb 11, 2002
Sold by
Elmore Fred T and Elmore Lesly L
Bought by
Southers Kevin
Purchase Details
Closed on
Mar 16, 2001
Sold by
Elmore Fred T and Elmore Lesly L
Bought by
Elmore Lesly L
Create a Home Valuation Report for This Property
The Home Valuation Report is an in-depth analysis detailing your home's value as well as a comparison with similar homes in the area
Home Values in the Area
Average Home Value in this Area
Purchase History
| Date | Buyer | Sale Price | Title Company |
|---|---|---|---|
| Smart Alison P | -- | None Available | |
| Flynn Alison P | $71,500 | -- | |
| Southers Kevin | $9,823 | -- | |
| Elmore Lesly L | -- | -- |
Source: Public Records
Mortgage History
| Date | Status | Borrower | Loan Amount |
|---|---|---|---|
| Open | Smart Alison P | $82,050 | |
| Closed | Flynn Alison P | $71,500 |
Source: Public Records
Tax History Compared to Growth
Tax History
| Year | Tax Paid | Tax Assessment Tax Assessment Total Assessment is a certain percentage of the fair market value that is determined by local assessors to be the total taxable value of land and additions on the property. | Land | Improvement |
|---|---|---|---|---|
| 2025 | $2,264 | $214,830 | $55,000 | $159,830 |
| 2024 | $2,219 | $210,520 | $55,000 | $155,520 |
| 2023 | $2,242 | $210,520 | $55,000 | $155,520 |
| 2022 | $1,408 | $107,870 | $22,500 | $85,370 |
| 2021 | $1,451 | $107,870 | $22,500 | $85,370 |
| 2019 | $1,422 | $104,950 | $22,500 | $82,450 |
| 2018 | $952 | $68,701 | $14,400 | $54,301 |
| 2017 | $924 | $68,701 | $14,400 | $54,301 |
| 2016 | $924 | $68,701 | $0 | $0 |
| 2014 | $938 | $69,715 | $18,000 | $51,715 |
Source: Public Records
Map
Nearby Homes
- 901 Edgemont Ave
- 1 Linestowe Dr
- 201 Sloan St
- 70 Volk St
- 204 13th St
- 206 13th St
- 405 Linestowe Dr
- 5949 Gilchrist Cir
- 318 6th St
- 1213 Sandra Ct
- 302 Planetree Dr
- 203 Ewing Dr
- 5 S 1st St
- 4830 Samuel Pinckney Dr
- 4813 Samuel Pinckney Dr
- 5141 Bright Rd
- 6030 Thorburn Way
- 116 Saint Giles Ct
- 104 Mckee Cir
- 3131 Channel View Landing