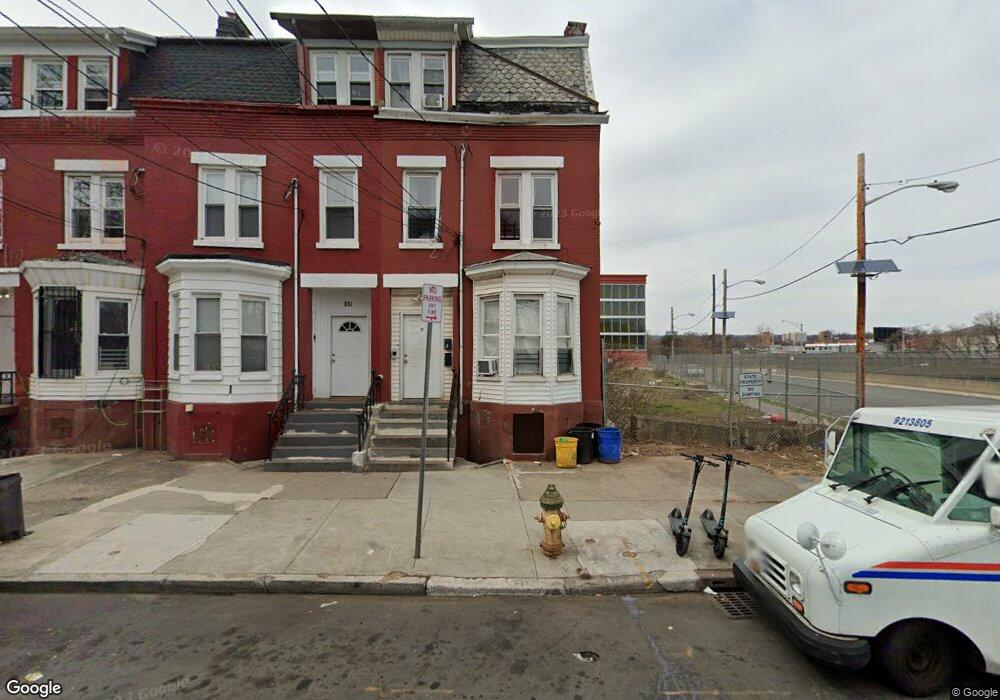
31 S 12th St Newark, NJ 07107
Fairmount NeighborhoodEstimated Value: $338,000 - $665,000
--
Bed
--
Bath
2,206
Sq Ft
$206/Sq Ft
Est. Value
About This Home
This home is located at 31 S 12th St, Newark, NJ 07107 and is currently estimated at $453,456, approximately $205 per square foot. 31 S 12th St is a home located in Essex County with nearby schools including Sir Isaac Newton Elementary School, Harriet Tubman School, and Camden Street Elementary School.
Ownership History
Date
Name
Owned For
Owner Type
Purchase Details
Closed on
Jul 25, 2024
Sold by
Moh Bsd Capital De 1 Llc
Bought by
Ogv 31 South Llc
Current Estimated Value
Purchase Details
Closed on
Nov 13, 2019
Sold by
South 12 Capital Llc
Bought by
Moh Bsd Capital De 1 Llc
Purchase Details
Closed on
Aug 12, 2019
Sold by
Newark City Of
Bought by
Stonerock Nuilders Llc
Purchase Details
Closed on
Apr 11, 2014
Sold by
City Of Newark
Bought by
South 12 Capital Llc
Purchase Details
Closed on
Dec 22, 1988
Sold by
Hicks Essie M
Bought by
Stokes Annette
Create a Home Valuation Report for This Property
The Home Valuation Report is an in-depth analysis detailing your home's value as well as a comparison with similar homes in the area
Home Values in the Area
Average Home Value in this Area
Purchase History
| Date | Buyer | Sale Price | Title Company |
|---|---|---|---|
| Ogv 31 South Llc | -- | None Listed On Document | |
| Ogv 31 South Llc | -- | None Listed On Document | |
| Moh Bsd Capital De 1 Llc | -- | Madison Title Agency, Llc | |
| Stonerock Nuilders Llc | $20,880 | -- | |
| South 12 Capital Llc | $38,750 | -- | |
| Stokes Annette | $55,000 | -- |
Source: Public Records
Tax History Compared to Growth
Tax History
| Year | Tax Paid | Tax Assessment Tax Assessment Total Assessment is a certain percentage of the fair market value that is determined by local assessors to be the total taxable value of land and additions on the property. | Land | Improvement |
|---|---|---|---|---|
| 2025 | $3,635 | $97,500 | $17,900 | $79,600 |
| 2024 | $3,635 | $97,500 | $17,900 | $79,600 |
| 2022 | $3,643 | $97,500 | $17,900 | $79,600 |
| 2021 | $3,641 | $97,500 | $17,900 | $79,600 |
| 2020 | $3,705 | $97,500 | $17,900 | $79,600 |
| 2019 | $3,667 | $97,500 | $17,900 | $79,600 |
| 2018 | $3,601 | $97,500 | $17,900 | $79,600 |
| 2017 | $3,471 | $97,500 | $17,900 | $79,600 |
| 2016 | $3,354 | $97,500 | $17,900 | $79,600 |
| 2015 | $3,226 | $97,500 | $17,900 | $79,600 |
| 2014 | $3,023 | $97,500 | $17,900 | $79,600 |
Source: Public Records
Map
Nearby Homes
- 69-71 N 13th St
- 102 S 14th St
- 126 N 14th St
- 106 S 11th St
- 603 Orange St
- 43 S 9th St
- 23 9th Ave
- 10 S 17th St
- 86 Steuben St
- 92 Steuben St
- 41 9th Ave
- 11 S 17th St
- 70 S 9th St
- 437-439 W 7th Ave Unit 4
- 437 7th Ave W Unit 439
- 142 Steuben St
- 160 S 11th St
- 57 N 7th St
- 123-25 Steuben St
- 123 Steuben St Unit 25