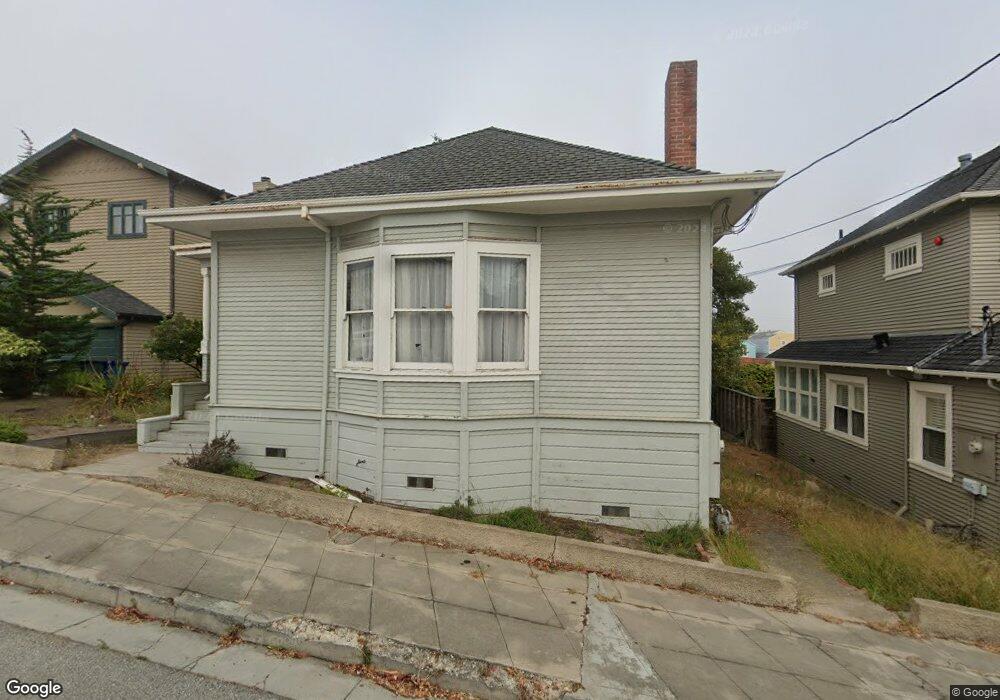
310 14th St Pacific Grove, CA 93950
Estimated Value: $1,265,876 - $1,307,000
3
Beds
2
Baths
1,227
Sq Ft
$1,048/Sq Ft
Est. Value
About This Home
This home is located at 310 14th St, Pacific Grove, CA 93950 and is currently estimated at $1,285,719, approximately $1,047 per square foot. 310 14th St is a home located in Monterey County with nearby schools including Robert Down Elementary School, Pacific Grove Middle School, and Pacific Grove High School.
Ownership History
Date
Name
Owned For
Owner Type
Purchase Details
Closed on
Dec 4, 2018
Sold by
Bramkamp Claudia A
Bought by
Bramkamp Claudia A and Claudia A Bramkamp Revocable Trust
Current Estimated Value
Purchase Details
Closed on
Oct 11, 2017
Sold by
Bramkamp Timothy G
Bought by
Bramkamp Michael F and Bramkamp Timothy G
Purchase Details
Closed on
Aug 15, 1996
Sold by
Bramkamp Lina
Bought by
Bramkamp Lina and Lina Bramkamp Living Trust
Purchase Details
Closed on
Feb 27, 1995
Sold by
Bramkamp Lina
Bought by
Bramkamp Lina
Create a Home Valuation Report for This Property
The Home Valuation Report is an in-depth analysis detailing your home's value as well as a comparison with similar homes in the area
Home Values in the Area
Average Home Value in this Area
Purchase History
| Date | Buyer | Sale Price | Title Company |
|---|---|---|---|
| Bramkamp Claudia A | -- | None Available | |
| Bramkamp Michael F | -- | None Available | |
| Bramkamp Lina | -- | -- | |
| Bramkamp Lina | -- | -- |
Source: Public Records
Tax History
| Year | Tax Paid | Tax Assessment Tax Assessment Total Assessment is a certain percentage of the fair market value that is determined by local assessors to be the total taxable value of land and additions on the property. | Land | Improvement |
|---|---|---|---|---|
| 2025 | $538 | $54,813 | $29,800 | $25,013 |
| 2024 | $538 | $53,739 | $29,216 | $24,523 |
| 2023 | $612 | $52,687 | $28,644 | $24,043 |
| 2022 | $599 | $51,655 | $28,083 | $23,572 |
| 2021 | $595 | $50,643 | $27,533 | $23,110 |
| 2020 | $583 | $50,125 | $27,251 | $22,874 |
| 2019 | $566 | $49,143 | $26,717 | $22,426 |
| 2018 | $557 | $48,181 | $26,194 | $21,987 |
| 2017 | $624 | $47,237 | $25,681 | $21,556 |
| 2016 | $624 | $46,312 | $25,178 | $21,134 |
| 2015 | $615 | $45,617 | $24,800 | $20,817 |
| 2014 | $604 | $44,725 | $24,315 | $20,410 |
Source: Public Records
Map
Nearby Homes
- 520 Lighthouse Ave Unit 301
- 157 15th St
- 224 16th St
- 410 Pine Ave
- 160 Monterey Ave
- 302 Park St
- 618 Forest Ave
- 132 Forest Ave
- 127 16th St
- 301 7th St
- 229 7th St
- 311 Lobos Ave
- 516 8th St
- 311 Lighthouse Ave
- 206 Cypress Ave Unit B
- 131 7th St
- 514 6th St
- 700 Briggs Ave Unit 77
- 700 Briggs Ave Unit 83
- 700 Briggs Ave Unit 84
Your Personal Tour Guide
Ask me questions while you tour the home.