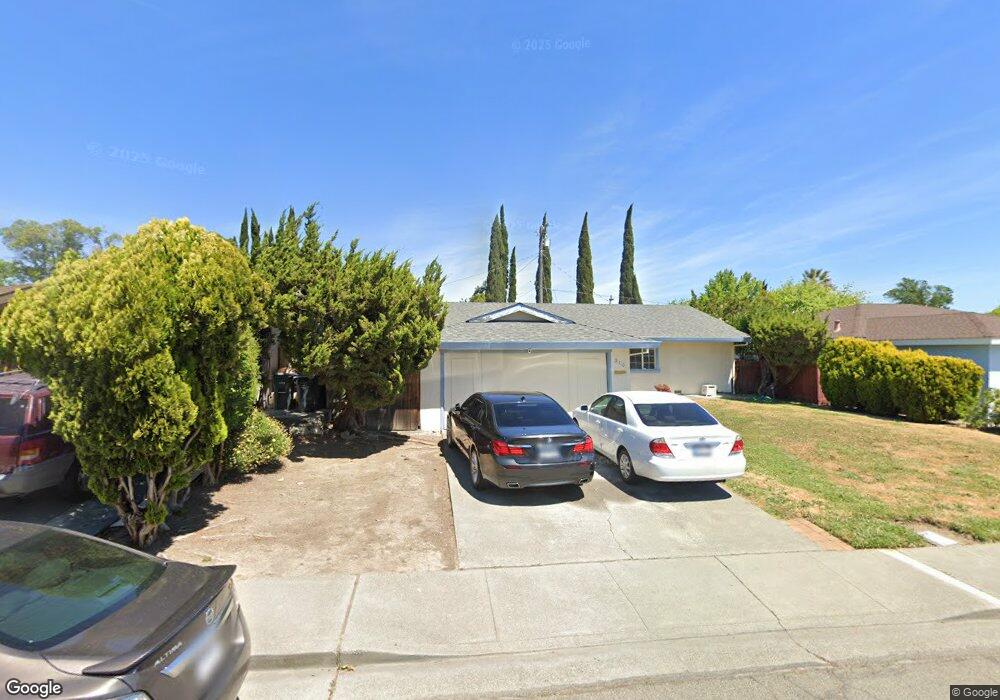
310 Begonia Blvd Fairfield, CA 94533
Estimated Value: $469,000 - $513,000
3
Beds
2
Baths
1,391
Sq Ft
$352/Sq Ft
Est. Value
About This Home
This home is located at 310 Begonia Blvd, Fairfield, CA 94533 and is currently estimated at $489,270, approximately $351 per square foot. 310 Begonia Blvd is a home located in Solano County with nearby schools including Dover Elementary School, Grange Middle School, and Fairfield High School.
Ownership History
Date
Name
Owned For
Owner Type
Purchase Details
Closed on
Feb 10, 1995
Sold by
Killen Lawrence E and Killen Marie C
Bought by
Ewell Brenda
Current Estimated Value
Home Financials for this Owner
Home Financials are based on the most recent Mortgage that was taken out on this home.
Original Mortgage
$129,514
Interest Rate
9.27%
Mortgage Type
FHA
Create a Home Valuation Report for This Property
The Home Valuation Report is an in-depth analysis detailing your home's value as well as a comparison with similar homes in the area
Home Values in the Area
Average Home Value in this Area
Purchase History
| Date | Buyer | Sale Price | Title Company |
|---|---|---|---|
| Ewell Brenda | $135,000 | Frontier Title Company |
Source: Public Records
Mortgage History
| Date | Status | Borrower | Loan Amount |
|---|---|---|---|
| Closed | Ewell Brenda | $129,514 |
Source: Public Records
Tax History
| Year | Tax Paid | Tax Assessment Tax Assessment Total Assessment is a certain percentage of the fair market value that is determined by local assessors to be the total taxable value of land and additions on the property. | Land | Improvement |
|---|---|---|---|---|
| 2025 | $3,977 | $226,741 | $67,181 | $159,560 |
| 2024 | $3,977 | $222,296 | $65,864 | $156,432 |
| 2023 | $3,900 | $217,938 | $64,573 | $153,365 |
| 2022 | $3,869 | $213,665 | $63,307 | $150,358 |
| 2021 | $3,844 | $209,476 | $62,066 | $147,410 |
| 2020 | $3,789 | $207,329 | $61,430 | $145,899 |
| 2019 | $3,720 | $203,265 | $60,226 | $143,039 |
| 2018 | $3,790 | $199,281 | $59,046 | $140,235 |
| 2017 | $2,189 | $195,375 | $57,889 | $137,486 |
| 2016 | $2,165 | $191,545 | $56,754 | $134,791 |
| 2015 | $2,021 | $188,669 | $55,902 | $132,767 |
| 2014 | $2,001 | $184,974 | $54,807 | $130,167 |
Source: Public Records
Map
Nearby Homes
- 278 Jasmine St
- 209 Begonia Blvd
- 2611 Lilac St
- 393 Manzanita Ave
- 2292 Rutland Ct
- 46 Anza Ct
- 2256 Dorset Ln
- 50 Anza Ct
- 2731 Orchid St
- 831 Heath Ct
- 15 Dali Ct
- 74 Anza Ct
- 519 Pacific Ave
- 937 Pacific Ave
- 41 Goya Dr
- 2219 Nottingham Dr
- 432 Chelsea Way
- 120 Goya Dr
- 2915 N Texas St Unit 129
- 2915 N Texas St Unit 157
Your Personal Tour Guide
Ask me questions while you tour the home.