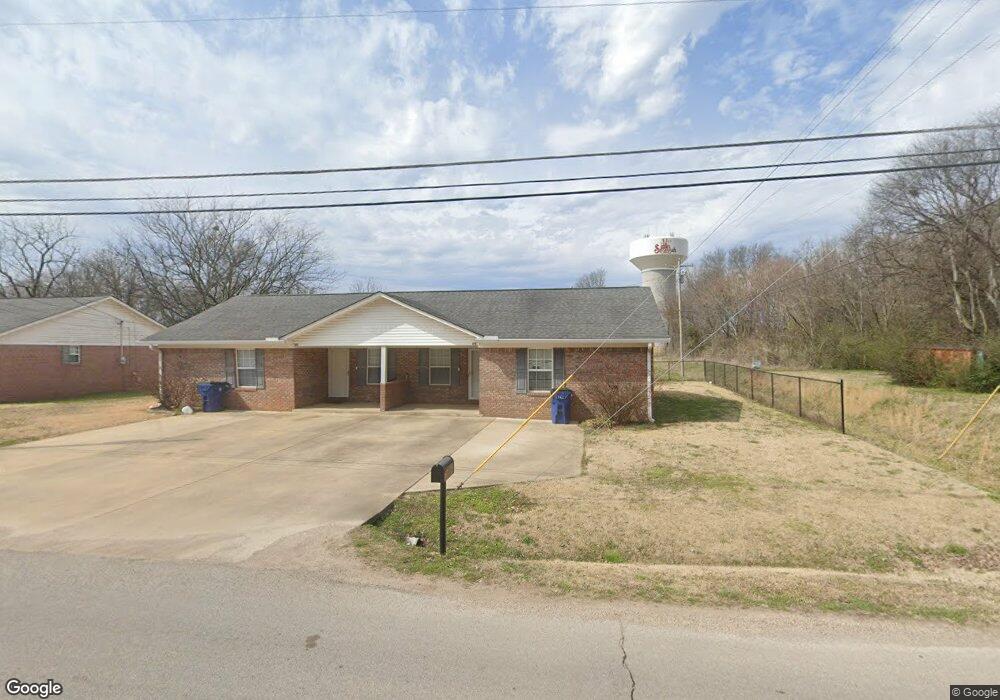
310 Belmont St Unit 320 Savannah, TN 38372
Estimated Value: $456,000 - $492,910
--
Bed
2
Baths
1,829
Sq Ft
$261/Sq Ft
Est. Value
About This Home
This home is located at 310 Belmont St Unit 320, Savannah, TN 38372 and is currently estimated at $477,228, approximately $260 per square foot. 310 Belmont St Unit 320 is a home located in Hardin County with nearby schools including Hardin County High School, Hardin County Christian School, and Savannah Christian Academy.
Ownership History
Date
Name
Owned For
Owner Type
Purchase Details
Closed on
Aug 2, 2016
Sold by
Thurman Shannon
Bought by
Thurman Kirk
Current Estimated Value
Purchase Details
Closed on
Nov 30, 2004
Sold by
David Christopher
Bought by
Kirk Thurman
Home Financials for this Owner
Home Financials are based on the most recent Mortgage that was taken out on this home.
Original Mortgage
$230,635
Interest Rate
5.67%
Purchase Details
Closed on
May 18, 1995
Sold by
Lois Barker
Bought by
Lois Barker
Purchase Details
Closed on
Jul 13, 1990
Bought by
Barker Lois
Purchase Details
Closed on
Apr 30, 1973
Bought by
Barker Ralph and Barker Lois
Create a Home Valuation Report for This Property
The Home Valuation Report is an in-depth analysis detailing your home's value as well as a comparison with similar homes in the area
Home Values in the Area
Average Home Value in this Area
Purchase History
| Date | Buyer | Sale Price | Title Company |
|---|---|---|---|
| Thurman Kirk | -- | -- | |
| Kirk Thurman | $211,051 | -- | |
| Lois Barker | $15,000 | -- | |
| Barker Lois | -- | -- | |
| Barker Ralph | -- | -- |
Source: Public Records
Mortgage History
| Date | Status | Borrower | Loan Amount |
|---|---|---|---|
| Previous Owner | Barker Ralph | $230,635 |
Source: Public Records
Tax History Compared to Growth
Tax History
| Year | Tax Paid | Tax Assessment Tax Assessment Total Assessment is a certain percentage of the fair market value that is determined by local assessors to be the total taxable value of land and additions on the property. | Land | Improvement |
|---|---|---|---|---|
| 2024 | -- | $178,920 | $10,800 | $168,120 |
| 2023 | $4,383 | $178,920 | $10,800 | $168,120 |
| 2022 | $3,348 | $121,320 | $10,320 | $111,000 |
| 2021 | $3,348 | $121,320 | $10,320 | $111,000 |
| 2020 | $3,348 | $121,320 | $10,320 | $111,000 |
| 2019 | $3,348 | $121,320 | $10,320 | $111,000 |
| 2018 | $3,265 | $121,320 | $10,320 | $111,000 |
| 2017 | $3,280 | $117,960 | $10,320 | $107,640 |
| 2016 | $3,280 | $117,960 | $10,320 | $107,640 |
| 2015 | $2,973 | $117,960 | $10,320 | $107,640 |
| 2014 | $2,973 | $117,960 | $10,320 | $107,640 |
Source: Public Records
Map
Nearby Homes