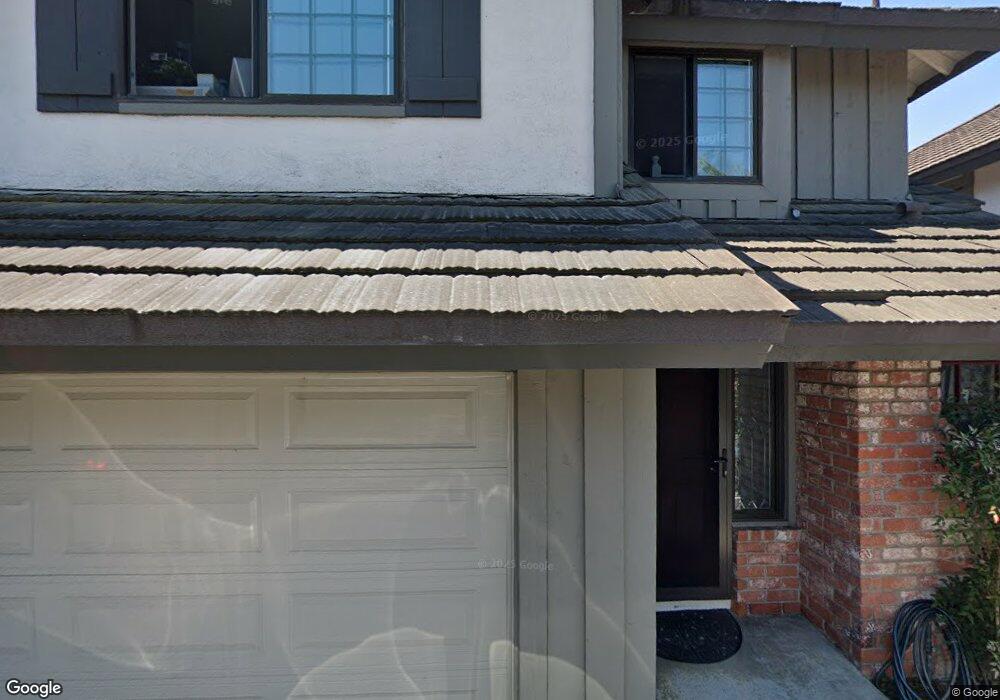
310 Campbell Ln Costa Mesa, CA 92627
Eastside Costa Mesa NeighborhoodEstimated Value: $1,222,615 - $2,277,000
3
Beds
3
Baths
1,707
Sq Ft
$890/Sq Ft
Est. Value
About This Home
This home is located at 310 Campbell Ln, Costa Mesa, CA 92627 and is currently estimated at $1,519,154, approximately $889 per square foot. 310 Campbell Ln is a home located in Orange County with nearby schools including Heinz Kaiser Elementary School, Woodland Elementary School, and Horace Ensign Intermediate School.
Ownership History
Date
Name
Owned For
Owner Type
Purchase Details
Closed on
Jul 15, 2014
Sold by
Gales Stephen Morrison
Bought by
Gales Stephen Morrison and Stephen Gales Living Trust
Current Estimated Value
Purchase Details
Closed on
Sep 17, 2010
Sold by
The Stephen Gales Living Trust
Bought by
Gales Stephen Morrison
Home Financials for this Owner
Home Financials are based on the most recent Mortgage that was taken out on this home.
Original Mortgage
$165,000
Interest Rate
4.27%
Mortgage Type
New Conventional
Purchase Details
Closed on
Apr 14, 2006
Sold by
Gales Stephen
Bought by
The Stephen Gales Living Trust
Purchase Details
Closed on
Sep 21, 2001
Sold by
Gales Rezeda
Bought by
Gales Stephen
Home Financials for this Owner
Home Financials are based on the most recent Mortgage that was taken out on this home.
Original Mortgage
$147,500
Interest Rate
6.91%
Create a Home Valuation Report for This Property
The Home Valuation Report is an in-depth analysis detailing your home's value as well as a comparison with similar homes in the area
Home Values in the Area
Average Home Value in this Area
Purchase History
| Date | Buyer | Sale Price | Title Company |
|---|---|---|---|
| Gales Stephen Morrison | -- | None Available | |
| Gales Stephen Morrison | -- | Pacific Coast Title Company | |
| The Stephen Gales Living Trust | -- | None Available | |
| Gales Stephen | -- | New Century Title Company |
Source: Public Records
Mortgage History
| Date | Status | Borrower | Loan Amount |
|---|---|---|---|
| Closed | Gales Stephen Morrison | $165,000 | |
| Closed | Gales Stephen | $147,500 |
Source: Public Records
Tax History
| Year | Tax Paid | Tax Assessment Tax Assessment Total Assessment is a certain percentage of the fair market value that is determined by local assessors to be the total taxable value of land and additions on the property. | Land | Improvement |
|---|---|---|---|---|
| 2025 | $3,669 | $306,247 | $144,924 | $161,323 |
| 2024 | $3,669 | $300,243 | $142,083 | $158,160 |
| 2023 | $3,583 | $294,356 | $139,297 | $155,059 |
| 2022 | $3,504 | $288,585 | $136,566 | $152,019 |
| 2021 | $3,432 | $282,927 | $133,888 | $149,039 |
| 2020 | $3,399 | $280,026 | $132,515 | $147,511 |
| 2019 | $3,337 | $274,536 | $129,917 | $144,619 |
| 2018 | $3,275 | $269,153 | $127,369 | $141,784 |
| 2017 | $3,220 | $263,876 | $124,872 | $139,004 |
| 2016 | $3,152 | $258,702 | $122,423 | $136,279 |
| 2015 | $3,119 | $254,817 | $120,585 | $134,232 |
| 2014 | $3,047 | $249,826 | $118,223 | $131,603 |
Source: Public Records
Map
Nearby Homes
- 2479 Rue de Cannes Unit B2
- 2302 Fairhill Dr
- 345 University Dr Unit F4
- 2587 Willo Ln
- 308 Alta Ln
- 2284 Redlands Dr
- 2200 Lake Park Ln
- 2553 Fairway Dr
- 315 University Dr
- 2400 Elden Ave Unit 12
- 2400 Elden Ave Unit 32
- 168 Monte Vista Ave
- 2563 Orange Ave Unit C
- 208 Susannah Place
- 389 Mira Loma Place
- 278 Virginia Place
- 310 Costa Bella Ct
- 311 Costa Bella Ct
- 206 Del Mar Ave
- 2616 Willo Ln
- 312 Campbell Ln
- 308 Campbell Ln
- 314 Campbell Ln
- 306 Campbell Ln
- 2432 Brittany Woods Ln
- 2432 Creswell Ln
- 316 Campbell Ln
- 2430 Santa Ana Ave Unit C1
- 2430 Santa Ana Ave Unit 2
- 2430 Santa Ana Ave Unit 1
- 2430 Santa Ana Ave Unit E1
- 2430 Santa Ana Ave Unit 10
- 2430 Santa Ana Ave Unit D1
- 2430 Santa Ana Ave Unit A1
- 2430 Santa Ana Ave Unit A2
- 2430 Santa Ana Ave Unit 3
- 2430 Santa Ana Ave Unit B1
- 2430 Santa Ana Ave Unit E2
- 2430 Santa Ana Ave Unit 7
- 2430 Santa Ana Ave Unit F2
Your Personal Tour Guide
Ask me questions while you tour the home.